
The Pin Bar indicator for MT4 is a useful candlestick analysis tool that automatically detects pin bar formations and highlights them directly on the chart.
Pin bars are one of the most recognized price action patterns because they can reveal rejection of certain price levels and possible changes in market direction.
Manually scanning multiple charts for pin bar formations can take considerable time.
This indicator works as a pin bar scanner, identifying potential bullish and bearish signals and displaying arrows when a valid pattern appears.
The tool is suitable for traders who use pure price action strategies as well as those who combine candlestick patterns with trend analysis, support and resistance, or other technical indicators.
Why traders use Pin Bar Indicator
Pin bars provide valuable information about market rejection.
A long wick shows that price moved strongly in one direction but was rejected before the candle closed, often suggesting that buyers or sellers are stepping into the market.
The Pin Bar Indicator helps traders locate these formations faster by automatically scanning the chart.
Instead of searching through every candle manually, users can focus on evaluating whether the detected pattern appears in a meaningful market location.
The indicator is especially useful when a pin bar forms near important technical areas such as support, resistance, trendlines, or supply and demand zones.
These locations can increase the importance of the signal and provide better trading opportunities.
For example, traders using supply and demand analysis can combine pin bar signals with key market zones.
When price approaches a demand zone, a bullish pin bar may confirm that buyers are defending the area.
When price reaches a supply zone, a bearish pin bar can indicate possible selling pressure.
Learn more about zone-based analysis with the Supply and Demand Zones Indicator for MT4.
Download This MT4 Indicator for Free
Indicator Chart Setup
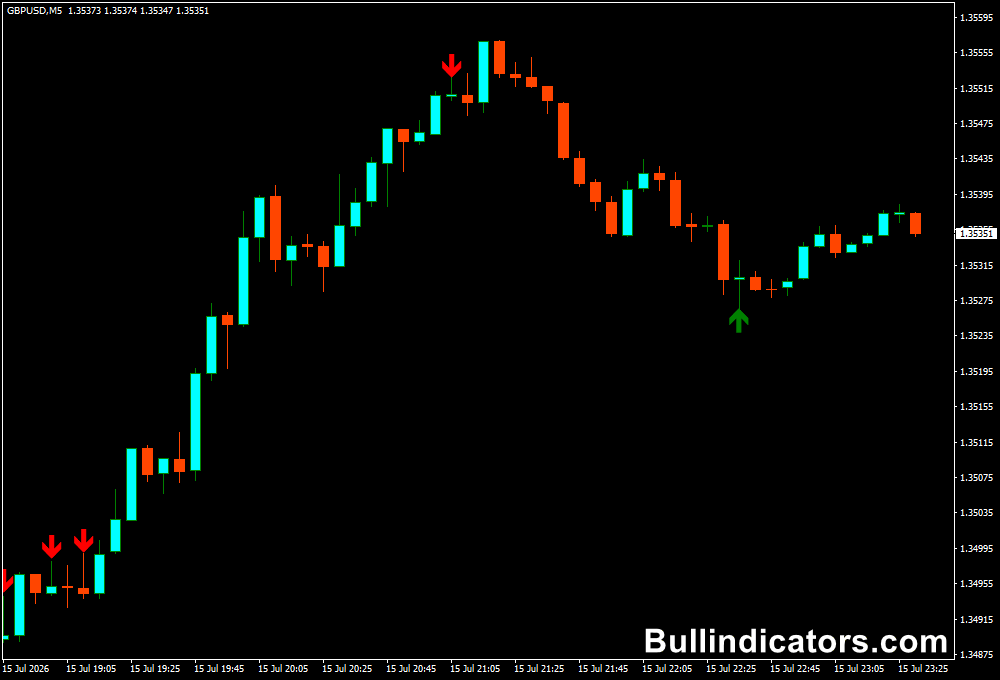
After attaching the Pin Bar Indicator to a MetaTrader 4 chart, the indicator scans candle formations and marks detected pin bars with visual arrows.
Bullish pin bars are displayed with an upward signal, while bearish pin bars receive a downward signal.
A bullish pin bar normally contains a long lower wick, showing that sellers pushed price down but buyers recovered before the candle closed.
A bearish pin bar has a long upper wick, indicating that buyers attempted to move higher but sellers rejected those levels.
The simple arrow-based display makes the indicator easy to read across different currency pairs and timeframes.
Core Features
- Automatically detects bullish and bearish pin bar formations
- Displays visual arrows directly on the MT4 chart
- Works as a candlestick pattern scanner
- Helps identify potential reversal opportunities
- Suitable for manual trading and Expert Advisors
- Supports multiple timeframes and markets
Best for
- Finding price rejection patterns quickly
- Learning and improving candlestick analysis
- Combining pin bars with support and resistance
- Building reversal-based trading strategies
- Confirming entries with additional technical analysis
Best Markets
- Major Forex pairs such as EUR/USD, GBP/USD, and USD/JPY
- Volatile pairs like GBP/JPY where reversals often occur
- Gold (XAU/USD) for price action-based setups
- Stock indices including NASDAQ and DAX
- Cryptocurrency markets with strong rejection moves
Trading Styles
- Price action trading using candlestick patterns
- Swing trading around major support and resistance levels
- Day trading with M15 and H1 reversal setups
- Trend continuation entries after pullbacks
- Multi-confirmation strategies combining zones and candle signals
How traders use it
Many users apply the Pin Bar Indicator by first identifying important market areas and then waiting for a pin bar confirmation.
The location of the pattern is often more important than the candle itself.
When price approaches a support area and forms a bullish pin bar, traders may consider a long setup after confirmation.
A stop loss is commonly placed below the low of the pin bar to protect against a failed reversal.
When price reaches resistance and creates a bearish pin bar, traders may look for short opportunities.
In this case, stop loss placement is often above the high of the candle.
A common approach is combining higher timeframe analysis with lower timeframe entries.
For example, a trader may identify the overall trend on the H4 chart and use M15 or M30 pin bars for more accurate entry timing.
Profit targets can be based on previous swing highs and lows, nearby support and resistance levels, or a predefined risk-to-reward ratio.
Get Instant Free Access
Indicator Settings
- Pin Bar Close: Defines whether the indicator confirms the pattern after the candle closes.
- Bullish Color: Adjusts the appearance of bullish pin bar signals.
- Bearish Color: Adjusts the appearance of bearish pin bar signals.
Important Notes
- A pin bar signal becomes more reliable when it appears near important price levels.
- The indicator identifies candle formations but does not predict future market movement.
- False signals can occur during ranging markets or periods of low liquidity.
- Combining pin bars with trend analysis and market structure can improve results.
- Always apply proper risk management when trading reversal patterns.









