
The Auto Trend Lines Channels indicator for MT4 is a technical analysis tool that automatically identifies important swing highs and swing lows to create trendlines and price channels on the chart.
Trendlines are one of the oldest price action techniques, helping traders understand market direction, momentum, and potential reversal areas.
Drawing accurate trendlines manually requires experience and can become time-consuming when analyzing multiple charts.
This indicator simplifies the process by scanning market movements and displaying possible trend structures automatically.
The tool is useful for both beginners who want assistance with trend analysis and experienced traders who need faster chart preparation.
Combined with price action techniques such as pin bars, inside bars, and breakout patterns, it can help identify possible trading opportunities around important market areas.
Why traders use Auto Trend Lines Channels Indicator
Trendlines often act as dynamic support and resistance levels where price may react.
However, markets can create multiple minor and major swings, making it difficult to identify every relevant trendline manually.
The Auto Trend Lines Channels Indicator helps users quickly locate these areas by connecting significant price movements automatically.
This allows traders to focus more on analyzing market behavior rather than spending time drawing lines across multiple charts.
The indicator also creates price channels, which can provide additional information about trend direction.
When price respects channel boundaries, these areas may become useful locations for planning entries, exits, and risk management.
Download This MT4 Indicator for Free
Download “auto-trend-lines-channels-indicator.ex4” Indicator
Indicator Chart Setup
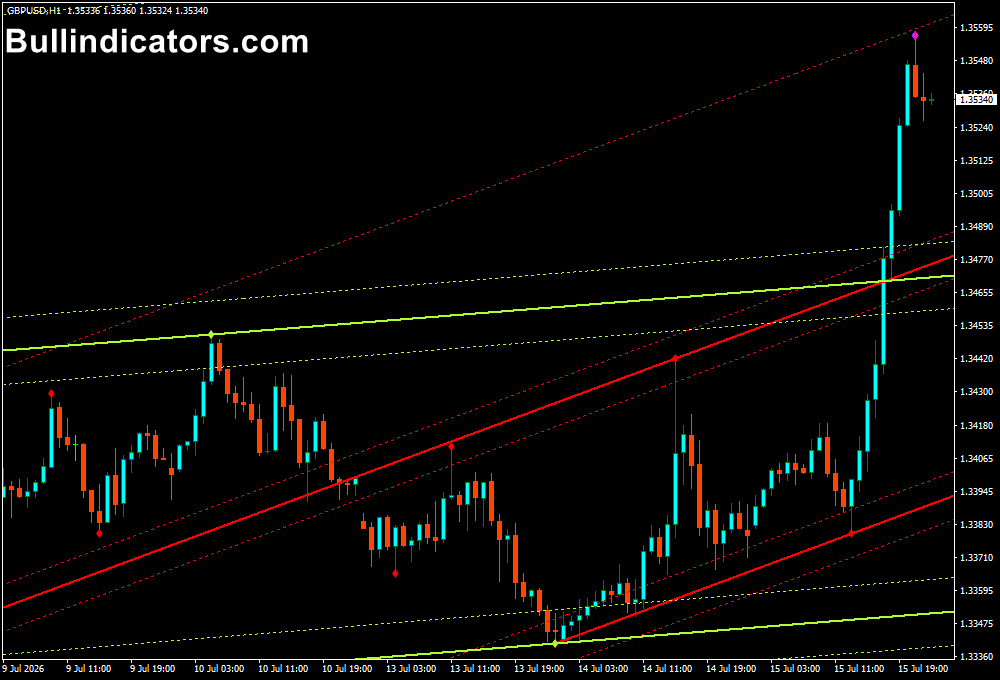
When applied to a MetaTrader 4 chart, the Auto Trend Lines Channels Indicator scans recent market swings and automatically draws trendlines connecting important highs and lows.
The chart can display both major and minor trend structures depending on the selected settings.
Major trendlines are normally displayed with stronger visual emphasis, while smaller trendlines highlight shorter-term price movements.
The indicator can also create channels based on these lines, helping users evaluate whether the market is moving upward, downward, or sideways.
The displayed trendlines can be used on different timeframes, from intraday charts such as M15 and H1 to higher timeframe analysis on H4 and daily charts.
Core Features
- Automatically detects market swing highs and swing lows
- Draws trendlines without manual chart analysis
- Creates dynamic price channels
- Displays major and minor trend structures
- Includes optional Fibonacci fan analysis
- Helps identify dynamic support and resistance areas
Best for
- Finding important trendline levels quickly
- Analyzing market direction and trend strength
- Planning entries around support and resistance zones
- Combining trendlines with price action patterns
- Multi-chart technical analysis
Best Markets
- Major forex pairs such as EUR/USD, GBP/USD, and USD/JPY
- Trending pairs like GBP/JPY and EUR/JPY with strong movements
- Gold (XAU/USD) where trend channels often develop clearly
- Stock indices such as NASDAQ and DAX
- Cryptocurrency markets with extended directional trends
Trading Styles
- Trend following based on channel direction
- Day trading using intraday trendline reactions
- Swing trading with higher timeframe channels
- Breakout trading when price leaves a channel
- Price action strategies around trendline support and resistance
How traders use it
A common method is to watch how price behaves when reaching an automatic trendline.
When price approaches rising trendline support and shows bullish confirmation, some traders look for buying opportunities.
When price reaches falling trendline resistance and shows rejection, bearish setups may develop.
Another approach is trading breakouts.
A strong move through a major trendline can indicate a possible change in market direction.
Traders often wait for confirmation, such as a candle close beyond the line or a retest of the breakout area.
The indicator becomes even more effective when combined with price action analysis.
Patterns such as pin bars, engulfing candles, and false breakouts can provide additional confirmation around the automatically identified levels.
Get Instant Free Access
Indicator Settings
- zz Visible: Determines how many ZigZag lines are calculated on the chart.
- zzColor: Changes the color of ZigZag lines.
- extColor: Adjusts the color of extended trendlines.
- fibofan: Enables or disables Fibonacci fan analysis combined with trendlines.
- fan Visible: Controls the number of trendlines displayed on the chart.
- fanStyle: Selects the visual style of automatic trendlines.
- fan Width: Changes the thickness of trendlines.
- Fibo FreeFan: Controls the number of Fibonacci retracement levels displayed.
- fibo Channel: Enables or disables channels based on Fibonacci levels.
- Colors: Allows customization of indicator colors.
- Push Notifications: Enables mobile alerts for indicator events.
Important Notes
- Automatic trendlines should be reviewed before entering trades.
- Not every trendline reaction leads to a successful setup.
- Higher timeframe trendlines generally carry more market significance.
- Combining trendlines with price action can improve signal quality.
- The indicator is a technical analysis aid and should be used with proper risk management.









