
The ADR indicator for MT4 displays the Average Daily Range together with the current day’s price range.
It helps traders estimate the expected movement of a currency pair and identify important intraday price zones where reactions may occur.
The Average Daily Range is widely used in forex analysis because markets often respect historical volatility levels.
By displaying the upper and lower ADR boundaries directly on the chart, this indicator helps traders monitor potential breakout areas, reversal zones, and realistic price targets.
Why traders use ADR Indicator
The ADR Indicator provides a simple way to understand how far a market has already moved and where price may reach during the trading day.
The displayed range levels can act as dynamic support and resistance areas, helping traders analyse possible turning points.
New traders can use ADR levels as reference points for studying price behaviour around daily extremes.
Experienced traders often combine the indicator with price action strategies, trend analysis, or other technical tools to improve their intraday setups.
Because the indicator is based on market volatility, it can adapt to different currency pairs and trading conditions.
Traders can adjust the calculation period to match their preferred strategy and the volatility characteristics of each market.
Download This MT4 Indicator for Free
Indicator Chart Setup
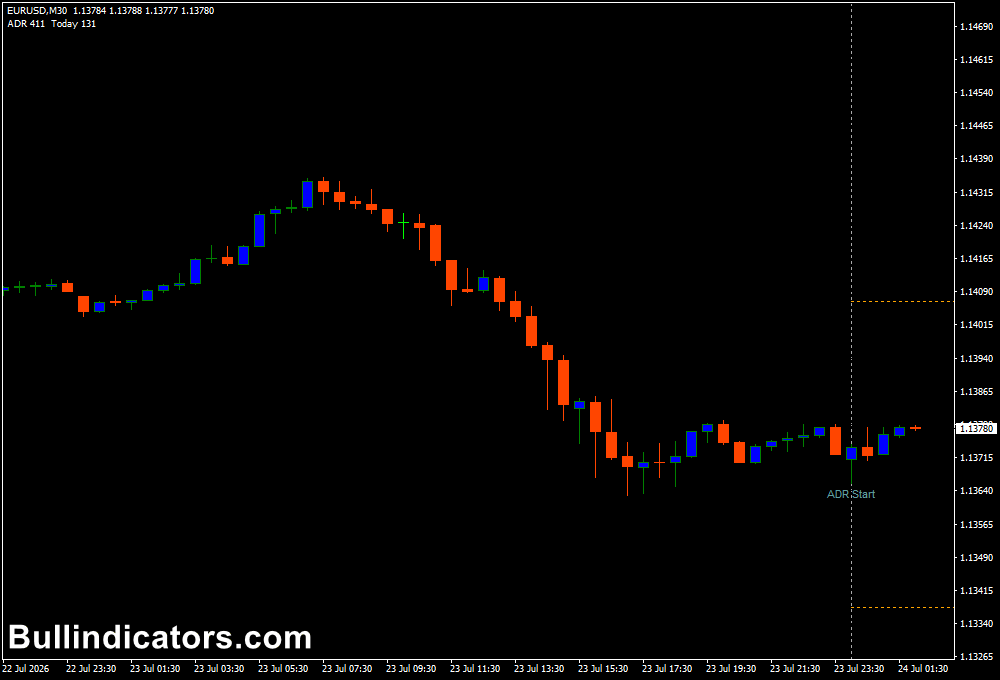
After applying the ADR Indicator to a MetaTrader 4 chart, traders will see the Average Daily Range information displayed on the chart, including the current day’s range values.
The indicator also plots upper and lower ADR levels as dotted lines extending across the trading session.
These levels allow traders to quickly identify whether price is approaching a potential daily extreme.
For example, when price reaches the upper ADR boundary, traders can monitor for reversal signals or a possible continuation breakout.
The same approach applies when price reaches the lower ADR level.
Core Features
- Displays the Average Daily Range of the selected market.
- Shows the current trading day’s price range.
- Plots upper and lower ADR levels on the chart.
- Uses ATR calculations to determine volatility.
- Helps identify intraday support and resistance zones.
- Includes adjustable timeframe and display settings.
Best for
- Analysing daily market volatility.
- Finding possible reversal areas.
- Planning breakout trading strategies.
- Setting realistic intraday profit targets.
- Combining volatility analysis with price action.
Best Markets
- EUR/USD, GBP/USD, and USD/JPY for daily range analysis.
- Gold (XAU/USD), where volatility levels are important for intraday trading.
- GBP/JPY and other fast-moving currency pairs.
- Major indices such as NASDAQ and DAX during active sessions.
- Commodities with strong daily price movements.
Trading Styles
- Intraday trading on M15, M30, and H1 charts using ADR boundaries.
- Breakout strategies when price moves beyond the daily range.
- Reversal trading near upper and lower ADR levels.
- Price action setups around ADR support and resistance zones.
- Volatility-based trading during London and New York sessions.
How traders use it
The ADR Indicator can be used for both breakout and reversal strategies.
Since the indicator highlights expected daily movement, traders can evaluate whether price is reaching an extended level or preparing for further momentum.
A common reversal strategy is to look for buying opportunities when price reaches the lower ADR level and shows bullish confirmation.
A stop-loss can be placed below the previous swing low, while the upper ADR level can be used as a potential target.
For bearish setups, traders can monitor price reactions near the upper ADR line.
If bearish price action appears, a sell position can be considered with risk placed above the recent swing high.
ADR levels should not be used as automatic signals.
Combining them with candlestick patterns, trend indicators, or momentum analysis can provide stronger confirmation.
Get Instant Free Access
Indicator Settings
- TimeZoneOfDate: Adjusts the broker time zone and GMT offset settings.
- TimeZoneOfSession: Sets the time zone used for the trading session calculation.
- ATRPeriod: Defines the ATR period used for calculating the Average Daily Range.
- Colors: Allows customization of indicator colours.
- Style: Adjusts the visual appearance of ADR lines and chart elements.
Important Notes
- The ADR Indicator shows expected price ranges and does not provide direct buy or sell signals.
- Different currency pairs have different volatility characteristics, so settings may require adjustment.
- Lower ATR periods react faster, while higher periods provide broader historical range calculations.
- Use proper risk management when trading near daily extremes.
- Combining ADR levels with price action can improve trade analysis.









