
The Trend Path Non-Repaint indicator for Metatrader 4 is an advanced trend reversal tool that combines volatility analysis, market extremes, and visual entry signals into one trading system.
It is designed to help traders identify possible turning points where price may reverse and begin a new directional move.
The indicator uses a dynamic band to analyze trend direction and volatility while highlighting potential overbought and oversold conditions.
Buy and sell arrows provide additional guidance, allowing traders to quickly recognize possible entry opportunities.
Because the signals do not repaint, traders can analyze previous setups with more confidence.
The Trend Path Non-Repaint can be applied to different trading approaches, including short-term scalping, intraday trading, and swing strategies.
It works particularly well when combined with price action patterns, support and resistance levels, or additional confirmation indicators.
Why traders use the Trend Path Non-Repaint Indicator
Finding the right moment to enter a reversal trade can be challenging.
Markets often move through extended bullish or bearish phases before momentum starts to weaken.
The Trend Path system helps traders identify areas where price may be reaching exhaustion and where a potential reversal could develop.
The combination of trend bands, reversal zones, and arrows gives traders multiple pieces of information at the same time.
Instead of relying only on one signal, traders can analyze whether the market environment supports the trade idea.
For example, a scalper may wait for an oversold reading, a blue buy arrow, and a bullish candlestick pattern before entering a position.
Swing traders may use the same concept on H4 charts while targeting larger price movements.
Download This MT4 Indicator for Free
Indicator Chart Setup
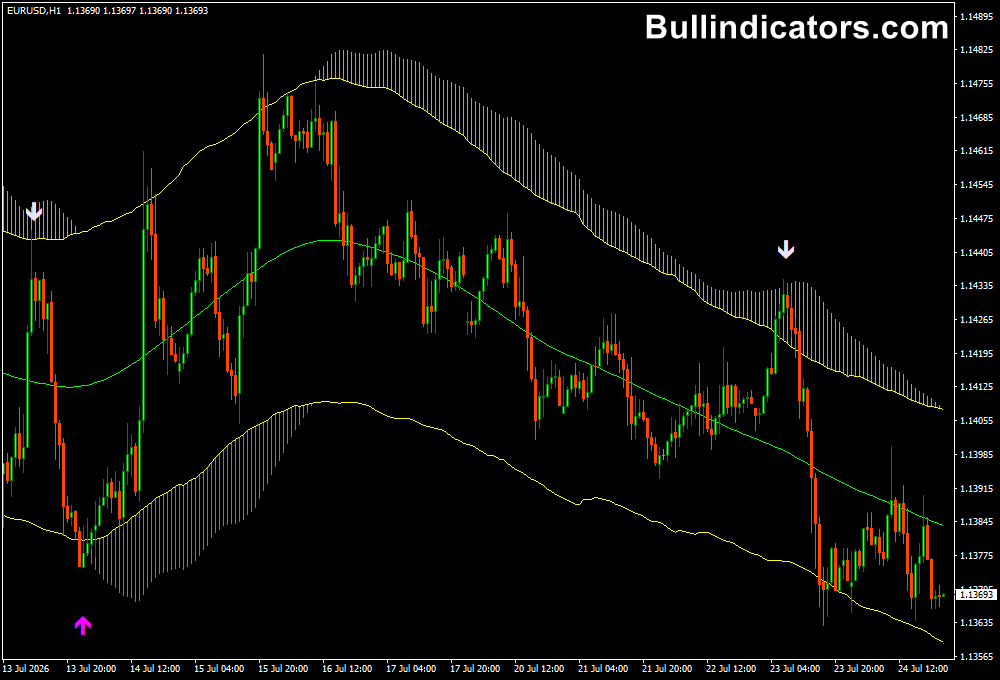
The Trend Path Non-Repaint Indicator appears directly on the price chart and displays a trend-following band together with colored market condition zones and trading arrows.
White bars represent overbought conditions, showing areas where upward momentum may be becoming exhausted.
Magenta bars highlight oversold conditions, which can indicate potential buying opportunities when combined with confirmation from price action.
The buy and sell arrows help traders identify possible reversal points.
A buy signal suggests bullish momentum may be developing, while a sell signal indicates possible bearish pressure.
Core Features
- Non-repainting trend reversal signals.
- Dynamic volatility-based trend bands.
- Overbought and oversold zone detection.
- Visual BUY and SELL arrows.
- Combines multiple technical calculations.
- Suitable for multiple trading styles.
- Works across different market conditions.
Best for
- Trend reversal trading.
- Momentum shifts.
- Price action confirmation.
- Finding potential market turning points.
- Multi-timeframe analysis.
- Combining signals with other technical tools.
Best Markets
- EUR/USD for clean technical setups.
- GBP/JPY for stronger volatility and reversal moves.
- USD/JPY during directional trends.
- Gold (XAU/USD) for momentum reversals.
- NASDAQ and US30 index trading.
- Major Forex pairs during active market sessions.
Trading Styles
- M1 and M5 scalping with additional confirmation.
- M15 short-term momentum trading.
- H1 intraday reversal strategies.
- H4 swing trading.
- Daily chart trend reversal analysis.
- Price action based strategies.
How traders use it
A common approach is to combine the indicator signals with price action confirmation.
Traders do not simply enter when an arrow appears; they look for additional evidence that buyers or sellers are taking control.
Example BUY setup:
- The EUR/USD H1 chart shows a decline toward a previous support area.
- The Trend Path Indicator marks an oversold zone with magenta colored bars.
- A magenta buy arrow appears after price rejects the lower band.
- A bullish engulfing candle closes above the previous candle high.
- A BUY trade is opened with a stop loss below the recent swing low.
- The position is managed toward the next resistance area or with a fixed risk-reward ratio.
This type of setup combines the indicator signal with market structure instead of relying on the arrow alone.
The same process can be applied to sell trades by looking for overbought conditions, bearish rejection, and confirmation from price action.
Scalpers can use the indicator on M1 and M5 charts, but additional confirmation is recommended because lower timeframes naturally contain more market noise.
Swing traders often prefer H4 and Daily charts because reversal zones tend to be more reliable on larger timeframes.
Get Instant Free Access
Indicator Settings
- Half Length: Controls the shape and calculation of the trend bands.
- Atr Length: Defines the ATR period used for volatility analysis.
- Atr Multiplier: Adjusts the sensitivity of the ATR-based calculations.
- Show Over: Enables or disables the overbought/oversold bars and arrows.
- Over BT: Changes the color used for overbought areas.
- Over SD: Changes the color used for oversold areas.
- Colors: Customize the visual appearance of the indicator.
Important Notes
- The strongest setups usually occur when indicator signals align with support and resistance zones.
- Lower timeframes can generate more signals but also require stronger filtering.
- Combining the indicator with candlestick patterns can improve reversal confirmation.
- Non-repainting signals allow traders to evaluate historical performance more accurately.
- Avoid entering trades only because an arrow appears without market confirmation.
- Higher timeframe signals generally provide more reliable reversal zones.
- Proper risk management remains essential for every trading strategy.









