
The Smart Money Concepts indicator for MT4 is an advanced market structure analysis tool designed for traders who follow institutional price action concepts.
The indicator automatically identifies important areas such as Break of Structure (BOS), Change of Character (CHoCH), Order Blocks, Equal Highs and Lows, and Fair Value Gaps.
By displaying these elements directly on the MetaTrader 4 chart, the tool helps traders understand how price moves between liquidity zones and important market areas.
It can be used to analyze trend continuation, possible reversals, and potential entry locations based on smart money trading principles.
Why traders use the Smart Money Concepts Indicator
Many professional trading approaches focus on market structure rather than relying only on traditional indicators.
The Smart Money Concepts Indicator simplifies this process by automatically marking important price action events that can influence future market movements.
The ability to identify BOS and CHoCH gives traders insight into whether the market is continuing its current direction or showing early signs of a possible reversal.
Order Blocks and Fair Value Gaps provide additional information about areas where price may react, making the indicator useful for traders who analyze institutional activity and liquidity movements.
The indicator can be adjusted for different trading approaches, from fast intraday setups to longer-term swing analysis.
Internal and swing structures allow users to examine both smaller price movements and larger market trends.
Download This MT4 Indicator for Free
Indicator Chart Setup
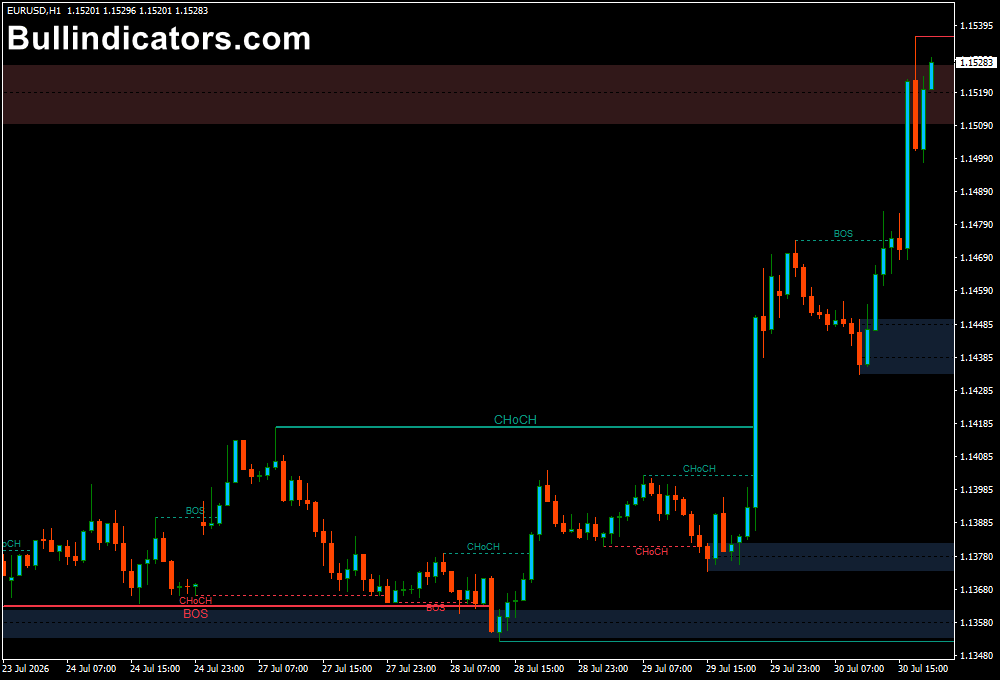
When applied to a MetaTrader 4 chart, the Smart Money Concepts Indicator creates a detailed market structure map.
It highlights bullish and bearish breaks, change of character signals, order blocks, liquidity areas, and fair value gaps.
The chart can display internal structures for short-term analysis as well as swing structures for broader trend evaluation.
Traders can also view premium and discount zones, which help identify whether price is trading at relatively expensive or attractive levels within a range.
Core Features
- Automatic detection of Break of Structure (BOS) and Change of Character (CHoCH)
- Displays internal and swing market structures
- Identifies bullish and bearish order blocks
- Highlights Equal Highs and Equal Lows liquidity areas
- Marks Fair Value Gaps for possible price reactions
- Shows premium, discount, and equilibrium zones
- Customizable chart display and calculation settings
Best for
- Analyzing institutional-style price action concepts
- Finding potential reversal and continuation areas
- Locating liquidity zones before entering trades
- Combining market structure with support and resistance analysis
- Building smart money trading strategies
Best Markets
- EUR/USD, GBP/USD, and other major forex pairs with strong liquidity
- Gold (XAU/USD) where order blocks and liquidity zones often create reactions
- US indices such as NAS100 and US30 during active market sessions
- Oil and commodity markets where price imbalance areas can develop
- Cryptocurrency markets with strong directional price movements
Trading Styles
- Scalping using internal market structure on M5 and M15 charts
- Day trading with BOS and CHoCH confirmation on M15 and H1
- Swing trading based on larger order blocks and trend direction
- Price action strategies focused on liquidity and market behavior
- Multi-timeframe analysis combining higher and lower timeframe structures
How traders use it
The Smart Money Concepts Indicator is commonly used to analyze where the market may continue moving or where a reversal could develop.
A Break of Structure can indicate that buyers or sellers have gained control, while a Change of Character may warn that the current trend is losing strength.
For example, during an uptrend, the indicator may highlight a bullish order block below current price.
If price returns to this area and reacts positively, the zone may become a potential entry area.
A trader can combine this information with candlestick patterns, volume analysis, or additional confirmation tools.
Equal Highs and Equal Lows are useful for identifying liquidity pools where stop orders may accumulate.
Fair Value Gaps can also help locate price inefficiencies that the market may revisit before continuing its movement.
Get Instant Free Access
Indicator Settings
- How many candles to calculate in history: Defines how many previous candles are analyzed to build the market structure map. The default setting of 2000 candles provides a broad historical view.
- Mode: Allows switching between Historical mode for reviewing previous structures and Real-Time mode for live market analysis.
- Style: Controls how market structure elements appear on the chart, including line styles and visual presentation.
- Color Candles: Changes candle colors according to bullish or bearish market structure conditions.
- Real Time Internal Structure: Displays smaller market movements as they develop, useful for short-term trading decisions.
- Show Internal Structure: Enables or disables internal trend information inside the larger market structure.
- Bullish Structure / Bullish Color: Controls the display and appearance of bullish market structure signals.
- Bearish Structure / Bearish Color: Controls the display and appearance of bearish market structure signals.
- Confluence Filter: Filters weaker market structure signals by requiring additional confirmation factors.
- Real Time Swing Structure: Displays larger price movements to identify important trend changes.
- Show Swing Points: Marks significant highs and lows that can act as future reaction zones.
- Length: Determines the swing calculation range. The default value of 50 controls how major swing points are identified.
- Show Strong/Weak High/Low: Highlights important highs and lows that may indicate breakout or reversal opportunities.
- Order Blocks: Enables order block identification based on previous buying and selling activity.
- Internal Order Blocks: Displays smaller order blocks created within short-term market structures.
- Order Block Filter: Uses filtering methods such as ATR to reduce weaker order block signals.
- Swing Order Blocks: Shows larger order blocks based on major market movements.
- Equal High/Low (EQH/EQL): Identifies matching highs and lows where liquidity may be concentrated.
- Bars Confirmation: Defines how many candles are required to confirm highs or lows. Default value is 3.
- Threshold: Filters minor price fluctuations. The default value of 0.1 helps reduce insignificant market movements.
- Fair Value Gaps (FVG): Displays price gaps that may become future reaction areas.
- Timeframe: Selects the timeframe used for market structure calculations.
- Bullish FVG/Bearish FVG: Customizes the appearance of bullish and bearish fair value gap zones.
- Extend FVG: Adjusts how far fair value gap zones extend across the chart.
- Show Daily/Weekly/Monthly Levels: Displays important higher timeframe high and low levels.
- Premium/Discount Zones: Shows price areas where the market may be considered overvalued or undervalued.
Important Notes
- The indicator is designed to support market analysis and should be combined with proper risk management.
- Market structure signals are more reliable when aligned with higher timeframe trends.
- Low liquidity periods can create weaker structure signals.
- Order blocks and fair value gaps should be confirmed with price reaction before entering a trade.
- Adjusting the settings can help adapt the tool to different markets and trading methods.









