
The Bheurekso Pattern indicator for MT4 is a powerful price action tool that automatically detects important Japanese candlestick formations directly on the trading chart.
Candlestick patterns provide valuable information about market sentiment, showing whether buyers or sellers are gaining control.
Manually identifying every candle formation can be time-consuming, especially when analyzing multiple currency pairs and timeframes.
This indicator scans the chart and highlights recognized patterns such as Engulfing, Harami, Hammer, and Morning Star formations.
Along with candlestick recognition, the indicator also displays support and resistance levels and possible entry signals.
This makes it a useful tool for traders who rely on pure price action analysis and want faster market evaluation.
Why traders use the Bheurekso Pattern Indicator
Candlestick analysis remains one of the most popular methods for understanding market behavior.
Individual candles and combinations of candles can reveal potential changes in momentum, continuation patterns, and possible reversal areas.
Traders use the Bheurekso Pattern Indicator because it removes the need to constantly scan charts manually for formations.
The indicator highlights important candle signals automatically, allowing traders to focus on analyzing the quality of each setup.
The additional support and resistance levels provide extra market context.
A bullish candlestick pattern near a strong demand area may offer a stronger trading opportunity than the same pattern appearing in the middle of a range.
Download This MT4 Indicator for Free
Indicator Chart Setup
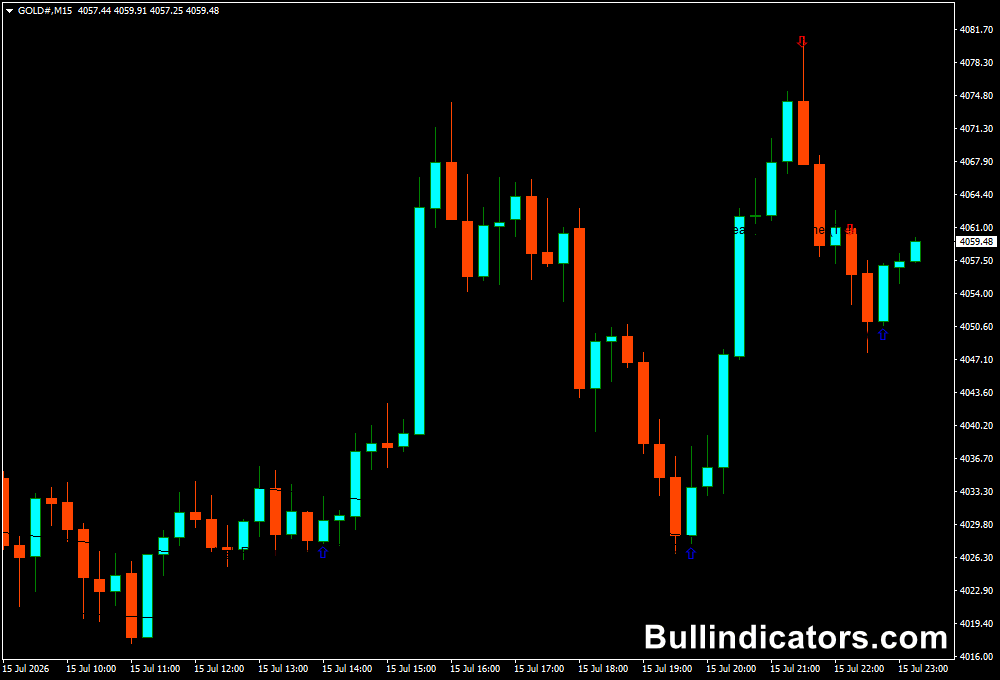
When attached to a MetaTrader 4 chart, the Bheurekso Pattern Indicator analyzes historical and current candles to identify recognized Japanese candlestick formations.
The detected patterns are displayed directly on the chart, making them easy to locate during technical analysis.
The indicator can mark bullish and bearish candle formations while also drawing horizontal support and resistance levels.
Forex traders can use these areas to evaluate whether a signal appears in a favorable market location.
The tool works across different timeframes, allowing traders to analyze short-term setups on charts such as M15 or H1, as well as larger market movements using daily charts.
Core Features
- Automatically identifies Japanese candlestick patterns
- Detects bullish and bearish reversal formations
- Displays support and resistance levels on the chart
- Provides possible buy and sell entry signals
- Works on multiple timeframes and currency pairs
- Useful for pure price action trading analysis
Best for
- Recognizing candlestick formations quickly
- Finding possible reversal opportunities
- Combining candle signals with support and resistance
- Learning and improving price action analysis
- Confirming entries with additional technical tools
Best Markets
- Major forex pairs such as EUR/USD, GBP/USD, and USD/JPY
- Volatile pairs like GBP/JPY where reversal patterns appear frequently
- Gold (XAU/USD) for price action-based setups
- Major stock indices including NASDAQ and S&P 500
- Cryptocurrency markets where candlestick patterns are widely used
Trading Styles
- Price action trading based on Japanese candlestick analysis
- Swing trading using daily and H4 reversal patterns
- Day trading with M15 and H1 confirmation signals
- Trend continuation strategies using candle formations
- Manual trading combined with technical indicators
How traders use it
Traders typically use the Bheurekso Pattern Indicator to locate potential trading opportunities based on candle behavior.
A bullish pattern, such as a Bullish Engulfing or Hammer, can indicate increasing buying pressure, especially when it forms near support.
Bearish patterns, including Bearish Engulfing or Bear Harami formations, may suggest weakening bullish momentum and possible downward movement.
Users often wait for additional confirmation before entering a trade, such as a break of a recent high or low.
The support and resistance levels displayed by the indicator can help traders decide where to place entries, stop losses, and profit targets.
PRO traders combine these signals with tools such as moving averages, MACD, or trend analysis for additional confirmation.
Get Instant Free Access
Indicator Settings
- Enable All Alerts: Activates notifications for detected candle patterns.
- Bullish Harami: Shows signals when a bullish Harami formation appears.
- Bullish Engulfing: Detects bullish engulfing candle patterns.
- Bullish Piercing Line: Identifies bullish piercing formations.
- Bullish Morning Star: Alerts when a morning star pattern develops.
- Bullish Hammer: Highlights bullish hammer candle signals.
- Bear Harami: Detects bearish Harami formations.
- Bear Piercing Line: Displays bearish piercing pattern signals.
- Colors: Allows customization of indicator appearance.
- Style: Adjusts the visual presentation of displayed signals and levels.
Important Notes
- Candlestick patterns should be analyzed within the overall market context.
- A candle signal becomes more reliable when supported by important price levels.
- The indicator identifies formations but does not guarantee future price movement.
- Understanding basic Japanese candlestick concepts helps traders interpret signals correctly.
- Combining the indicator with risk management and confirmation methods can improve trading decisions.









