
The Givonly SnR SnD R2 Indicator for MT4 automatically plots important support and resistance levels from multiple timeframes on the current chart.
It also identifies supply and demand areas, giving you a practical reference for locating potential reaction zones without manually drawing every level.
The combination of higher-timeframe levels with lower-timeframe price action makes this tool particularly useful for intraday analysis.
A level from H1, H4, D1, or W1 can remain highly relevant when trading on M5 or M15, allowing short-term setups to be evaluated in the context of larger market levels.
Why traders use the Givonly SnR SnD R2 Indicator
Support and resistance remain fundamental parts of technical analysis because they identify areas where price has previously encountered buying or selling pressure.
Having these levels plotted automatically can make it easier to locate potential entry, exit, and breakout areas.
The supply and demand component adds another layer to the analysis.
Demand zones can highlight areas where buying interest previously appeared, while supply zones can identify regions where selling pressure emerged.
When these areas overlap with established support or resistance, the resulting confluence can provide a stronger technical setup.
Download This MT4 Indicator for Free
Indicator Chart Setup
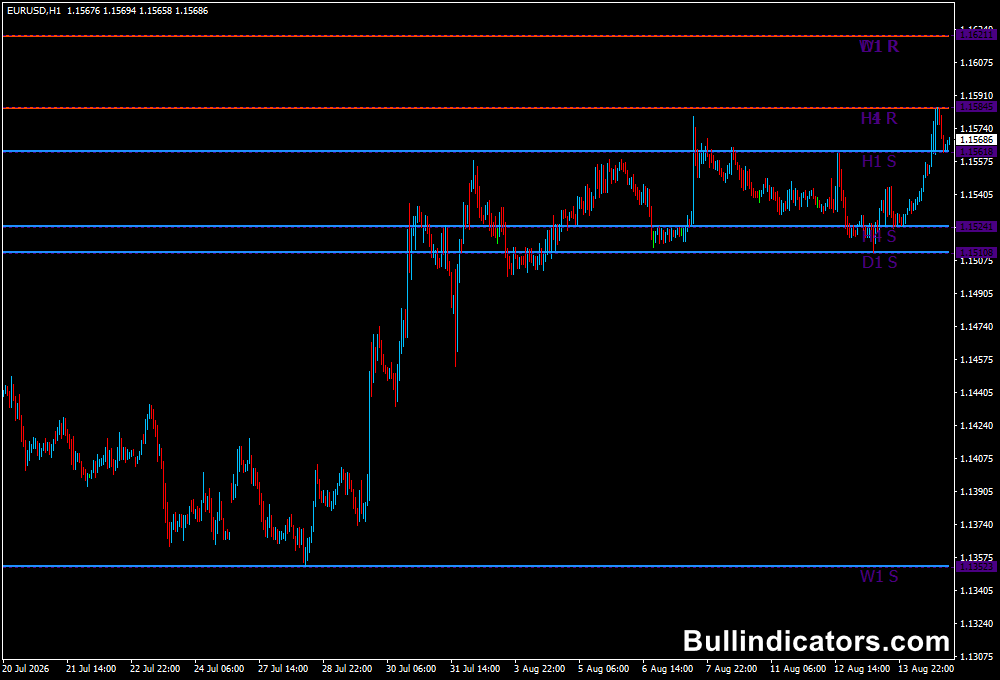
The chart can display support and resistance levels calculated from H1, H4, D1, and W1 data.
Support levels are shown in blue, while resistance levels are displayed in red, making the different reference zones easy to distinguish.
Supply and demand areas are also plotted according to the selected width setting.
You can choose which higher-timeframe levels to display, allowing the chart to remain focused on the timeframes most relevant to your trading plan.
Core Features
- Plots H1, H4, D1, and W1 support and resistance levels.
- Identifies supply and demand areas.
- Displays higher-timeframe levels on lower-timeframe charts.
- Uses separate colors for support and resistance.
- Allows the supply and demand area width to be adjusted.
- Useful for both reversal and breakout analysis.
Best for
- Finding potential reversal zones before entering a trade.
- Locating higher-timeframe support and resistance on intraday charts.
- Identifying breakout levels and potential retests.
- Combining price levels with Fibonacci or momentum analysis.
- Planning entries with defined support and resistance targets.
Best Markets
- EURUSD for clean intraday reactions around established technical levels.
- GBPUSD when London-session volatility interacts with higher-timeframe zones.
- USDJPY for combining Asian-session movement with H4 and daily levels.
- GBPJPY for larger intraday swings between major support and resistance areas.
- XAUUSD when strong directional moves approach significant daily or weekly levels.
Trading Styles
- Scalping on M5 and M15 using higher-timeframe zones as trade locations.
- Intraday trading on M15 and H1 around established levels.
- Swing trading with H4, D1, and W1 support and resistance.
- Breakout and retest strategies.
- Supply and demand reversal setups.
How traders use it
A basic reversal strategy is to wait for price to approach a support or demand area and then look for bullish price action.
For bearish trades, the focus shifts toward resistance and supply.
The strongest setups can occur when several timeframe levels overlap in the same price region.
Buy Setup at Support or Demand
- Identify a blue support level or demand area below current price.
- Wait for price to reach or enter the zone.
- Look for bullish rejection, an engulfing candle, or another confirmation pattern.
- Confirm that the broader market is not strongly bearish.
- Enter a buy after bullish confirmation.
- Place the stop loss below the support or demand zone.
- Use the next resistance level as a potential profit target.
Sell Setup at Resistance or Supply
- Identify a red resistance level or supply area above current price.
- Wait for price to test the zone.
- Look for bearish rejection or a confirming price-action formation.
- Check the broader trend before entering against market momentum.
- Enter a sell after bearish confirmation.
- Place the stop loss above the resistance or supply zone.
- Use the next support level as a potential profit target.
Multi-Timeframe Confluence
One of the more useful applications is finding levels from different timeframes that overlap closely.
For example, an H1 support level that aligns with H4 support and a demand zone can represent a more significant reaction area than an isolated intraday level.
Fibonacci retracements, trend lines, or moving averages can provide additional confirmation.
Get Instant Free Access
Indicator Settings
- SHOW_H1: Enables or disables the H1 support and resistance levels.
- SHOW_H4: Displays or hides H4 support and resistance levels.
- SHOW_D1: Controls the display of daily support and resistance.
- SHOW_W1: Enables the weekly support and resistance levels.
- Supply_Demand_Area: Determines the width of the displayed supply and demand areas.
- SupportColor: Sets the color used for support levels.
- ResistanceColor: Sets the color used for resistance levels.
Important Notes
- Always consider the main trend before taking reversal trades from support, resistance, supply, or demand.
- A level can be broken, so wait for price-action confirmation rather than assuming every zone will hold.
- Multiple timeframe confluence can strengthen a setup, but it does not guarantee a reversal.
- Breakout traders can monitor how price closes beyond a level and whether the area holds during a subsequent retest.
- Higher-timeframe levels can remain relevant for intraday trades even when using M5 or M15 charts.
- Use sensible stop-loss placement beyond the zone and maintain consistent risk management.









