
The Elliott Wave Count Indicator for MT4 simplifies one of the most well-known but complex approaches in technical analysis by automatically plotting wave structures directly on the chart.
It identifies impulse and corrective phases, allowing traders to follow market cycles without manually counting waves.
Why traders use the Elliott Wave Count Indicator
Traders use this indicator because Elliott Wave analysis can be complex when done manually.
The tool simplifies the process by automatically mapping wave structures, allowing traders to focus on execution rather than interpretation.
In a bullish structure, traders often look for buy opportunities around the end of wave 2 or the start of wave 3, while wave 3 and wave 5 provide continuation opportunities.
In bearish conditions, similar logic applies in reverse.
These wave zones often align with natural support and resistance areas formed by previous price swings.
Download This MT4 Indicator for Free
Indicator Chart Setup
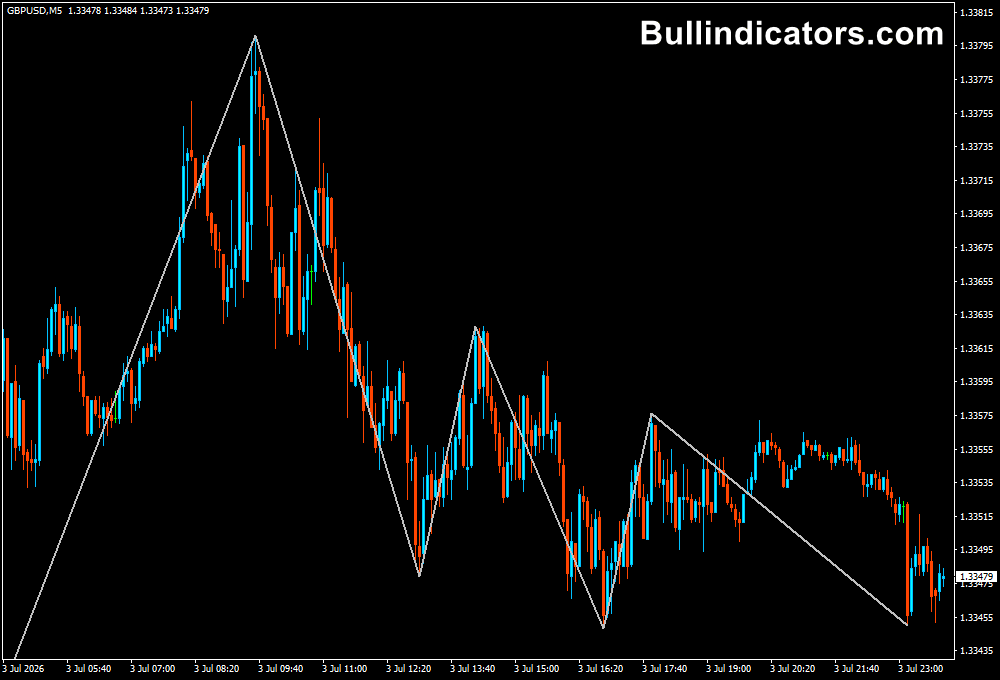
When applied to MetaTrader 4, the indicator automatically labels impulse and corrective waves directly on the main price chart.
Wave counts are dynamically updated using swing logic based on depth, deviation, and backstep settings.
This allows traders to follow the structure of the market across both short-term and long-term cycles without manually drawing wave patterns.
Core Features
- Automatic Elliott Wave detection and labeling
- Pure, non-repaint price action.
- Identification of impulse and corrective structures
- Multi-timeframe wave interpretation support
- Dynamic swing-based recalculation
- Helps identify trend phases and reversals
Best for
- Identifying full market cycles and wave structures
- Timing entries within trend continuation phases
- Spotting potential reversal zones
- Combining with Fibonacci analysis
- Multi-timeframe technical analysis
Best Markets
- Major Forex pairs such as EUR/USD, GBP/USD, and USD/JPY during strong trending phases
- Cross pairs like EUR/JPY, GBP/JPY, and AUD/JPY where clear wave structures form
- Gold (XAU/USD) which often develops strong impulsive and corrective wave cycles
- Stock indices such as NASDAQ 100, S&P 500, and DAX 40 during directional trends
- Cryptocurrency CFDs such as BTC/USD and ETH/USD where wave patterns are highly visible
Trading Styles
- Scalping trading based on wave cycles
- Position trading using higher timeframe wave structures
- Intraday trading on H1 and H4 wave formations
- Trend following within wave 3 and wave 5 impulses
- Reversal trading at corrective wave completions
How traders use it
Forex traders typically use the Elliott Wave Count Indicator to identify the beginning of a new impulse structure.
For example, when a bullish wave 1 is formed followed by a corrective wave 2, traders prepare for a potential wave 3 continuation move.
Example on the EURUSD H1 chart:
On EUR/USD H1, the indicator identifies wave 1 impulsive growth followed by a retracement into wave 2.
Traders wait for confirmation of wave 3 starting, often entering a BUY trade at the breakout above the wave 1 high.
Stop-loss is placed below the wave 2 low, while profit targets are projected toward the end of wave 3 and possibly wave 5 if momentum continues.
This same structure can be applied in reverse during bearish cycles, where wave 2 retracements into resistance zones offer early SELL opportunities before wave 3 downside expansion begins.
Get Instant Free Access
Indicator Settings
- ExtDepth: Defines the number of bars used for historical wave detection.
- ExtDeviation: Controls how sensitive the indicator is to trend reversals.
- ExtBackstep: Sets spacing between swing highs and lows for wave calculation.
Important Notes
- Elliott Wave structures perform best in strong trending markets.
- Lower timeframes may show more noise and re-labeling of waves.
- Combining with Fibonacci levels improves wave entry accuracy.
- Wave counts should be confirmed with price action.
- Multi-timeframe analysis increases reliability significantly.









