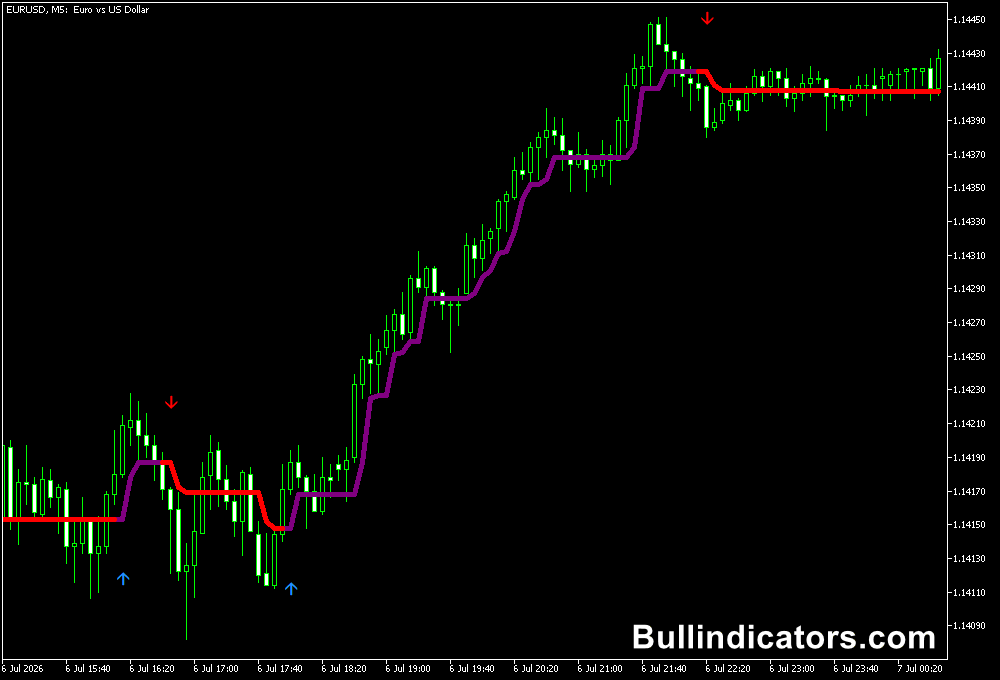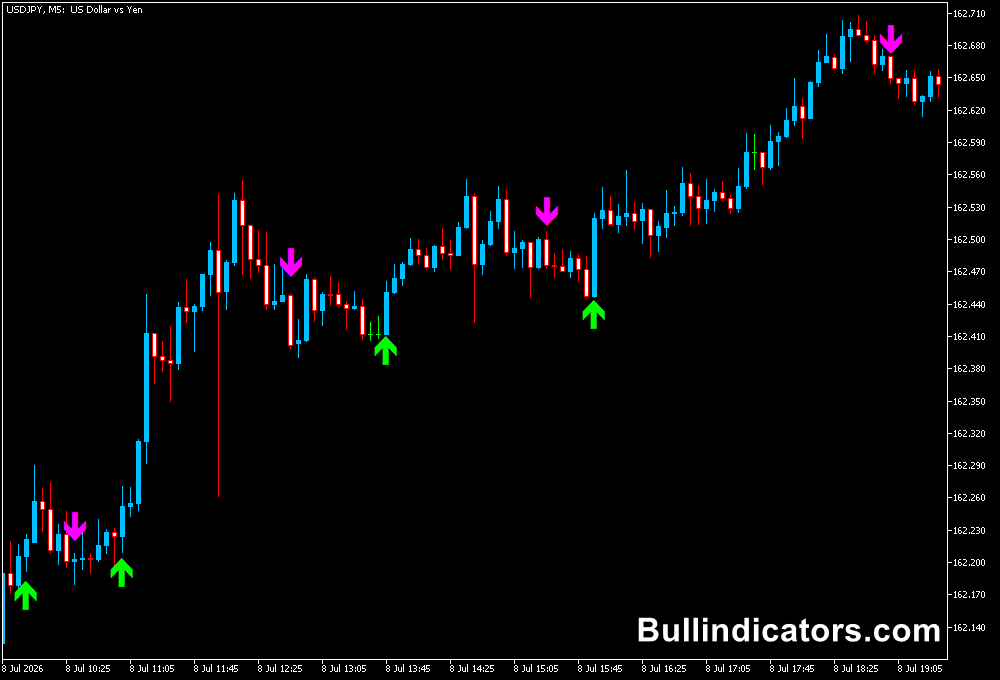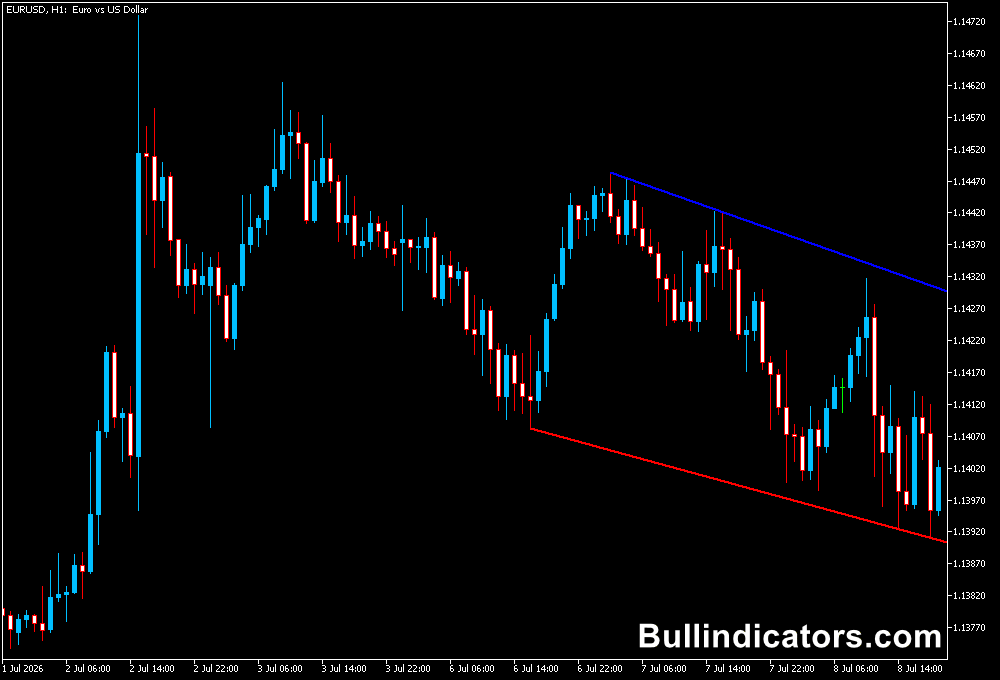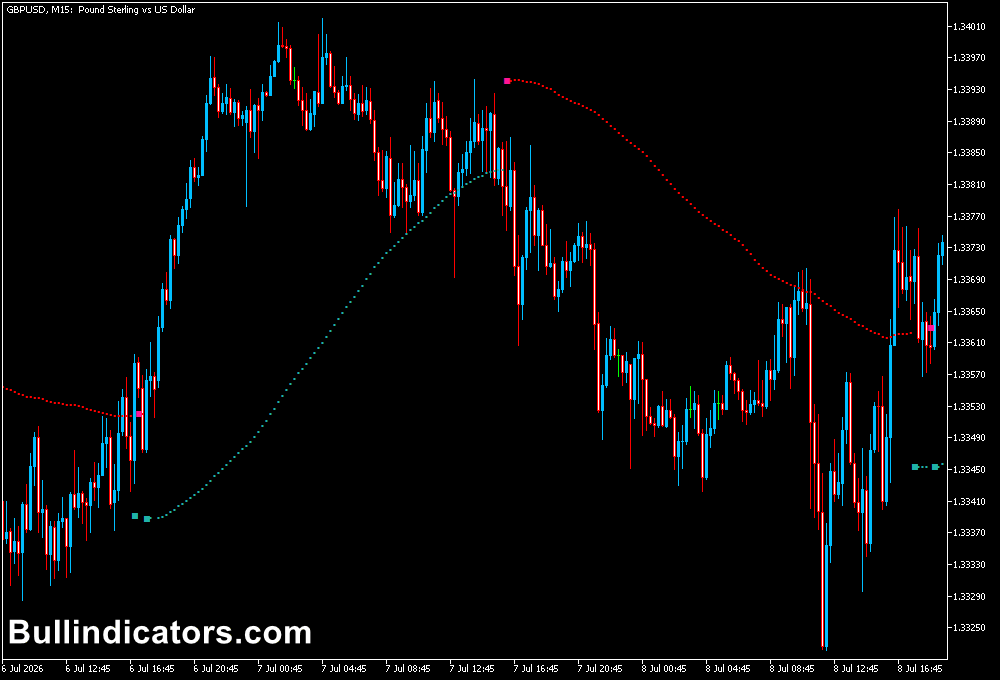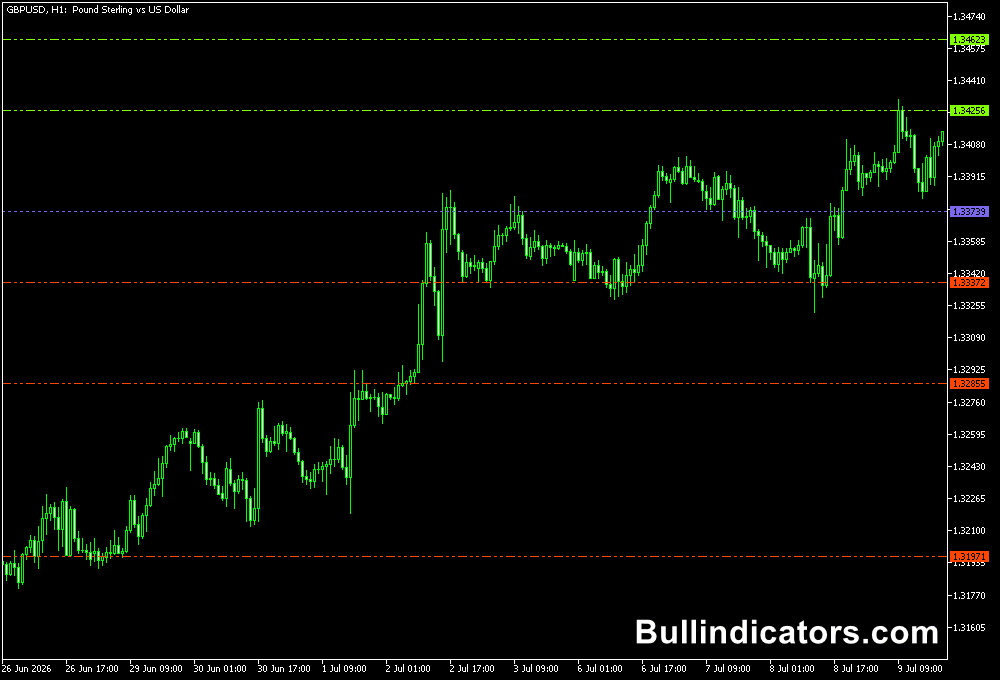
The Givonly SnR SnD Indicator for MT5 automatically plots support and resistance levels from multiple higher timeframes on the current chart.
H1, H4, daily, and weekly levels can be displayed, giving you a clear view of important price areas without having to draw them manually.
The indicator also helps with supply and demand analysis.
These areas can be used to identify potential reversal zones, breakout locations, and areas where price may react.
Because higher-timeframe levels remain relevant when moving down to lower charts, the indicator is particularly useful for swing and position-oriented analysis.
Why traders use the Givonly SnR SnD Indicator
Support and resistance form an important part of technical analysis, but manually identifying multiple timeframe levels can take time.
Givonly SnR SnD automatically places these levels on the chart, allowing the current price to be evaluated against established areas from H1 through weekly timeframes.
The real benefit comes from combining several levels.
When H4 and daily support, for example, are located close to each other, that area deserves closer attention than an isolated level.
The same principle applies when multiple resistance levels converge around a similar price.
The indicator can be used for both reversal and breakout analysis.
A swing trader can monitor how price reacts around weekly resistance, while an intraday setup can use H1 or H4 levels to define potential entry and target areas.
Download This MT5 Indicator for Free
Indicator Chart Setup
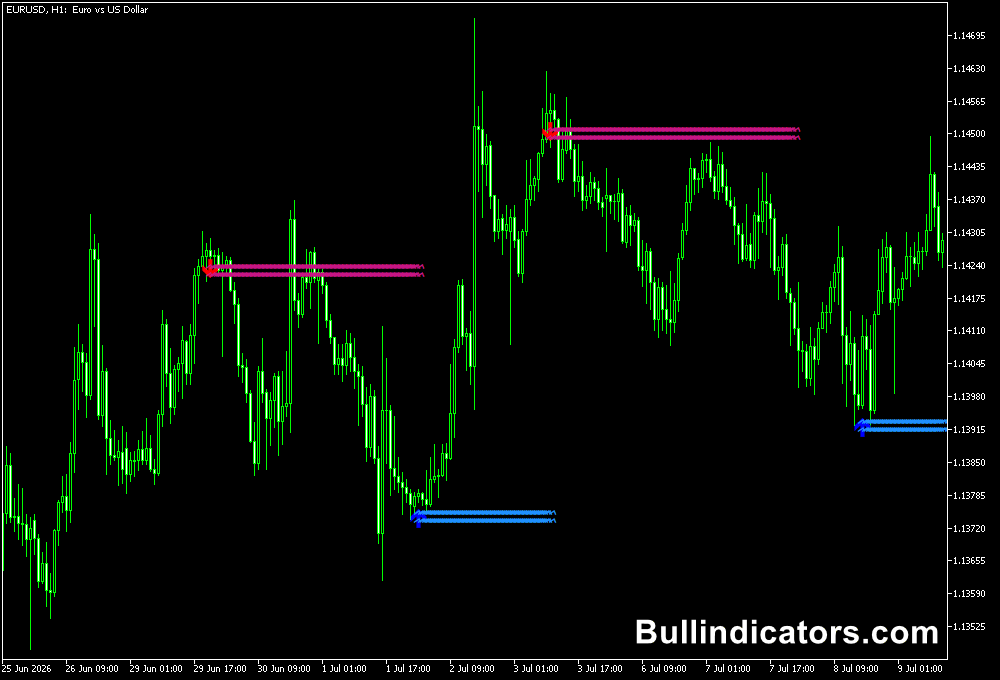
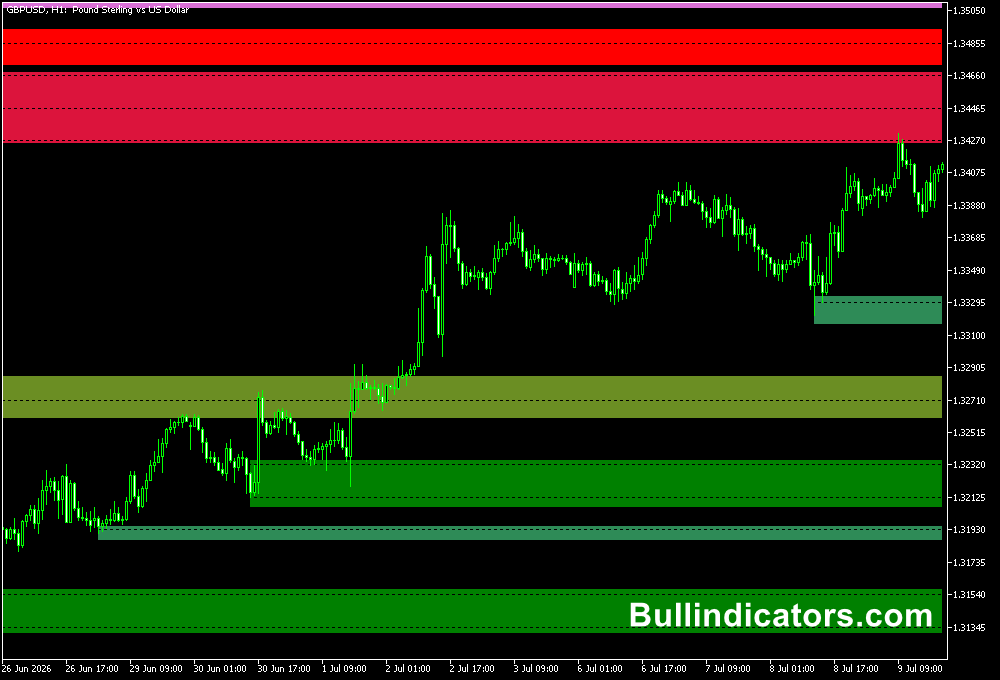
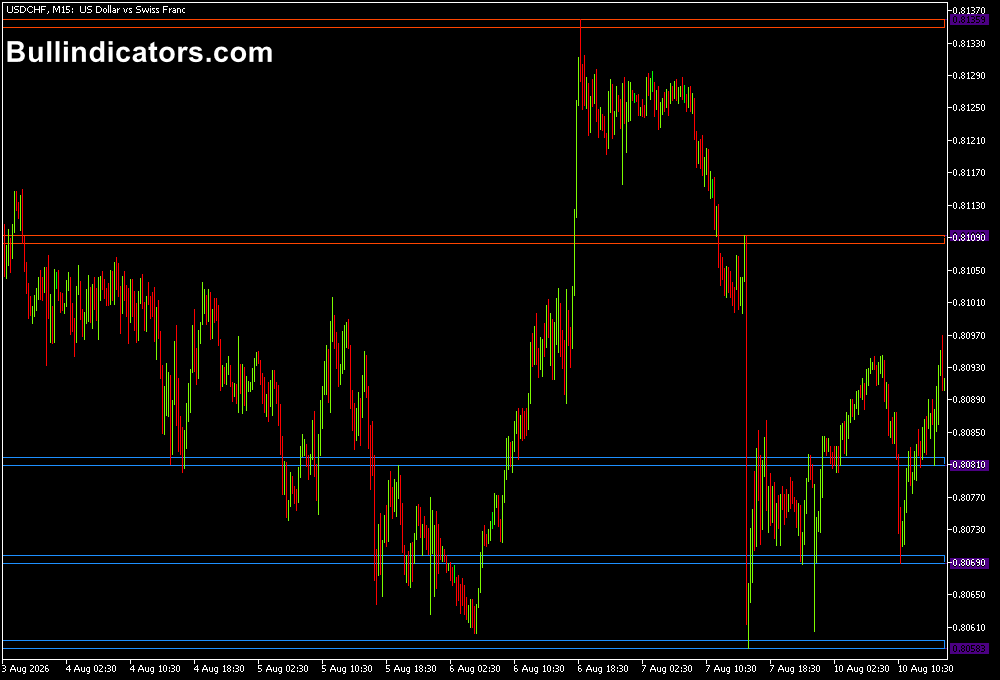
The indicator displays support levels in blue and resistance levels in red.
Depending on the selected settings, H1, H4, D1, and W1 levels can appear on the current chart.
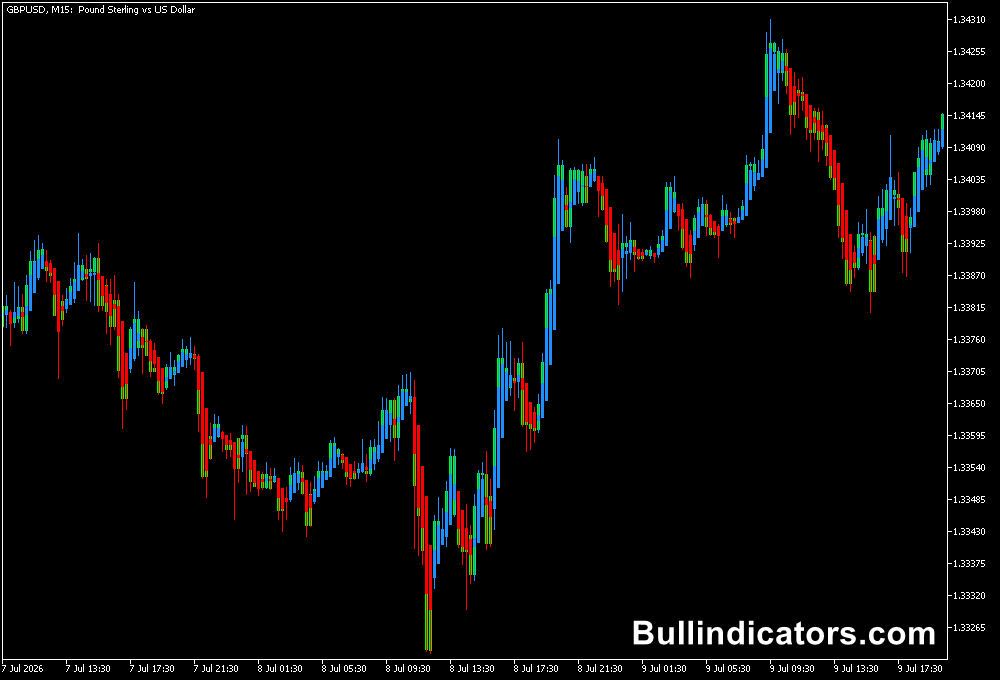
This allows a lower timeframe chart such as M15 or H1 to show where higher-timeframe support and resistance are located.
The levels can then be compared with current price action.
A reaction from support may be monitored for a potential long setup, while resistance can be watched for a possible short setup or breakout.
Multiple timeframe levels meeting around the same price can provide additional confluence.
Core Features
- Automatically plots higher-timeframe support and resistance.
- Displays H1, H4, daily, and weekly levels.
- Provides visual support and resistance zones for supply and demand analysis.
- Allows individual timeframes to be enabled or disabled.
- Useful for reversal, breakout, and confluence strategies.
- Can be combined with Fibonacci levels and other technical indicators.
Best for
- Identifying important swing trading levels.
- Planning entries around higher-timeframe support and resistance.
- Finding potential reversal areas.
- Locating breakout levels before price reaches them.
- Comparing multiple timeframe levels for stronger confluence.
Best Markets
- EURUSD and GBPUSD for clean major-pair support and resistance analysis.
- GBPJPY and EURJPY when wider price swings create significant higher-timeframe levels.
- XAUUSD for monitoring major daily and weekly reaction areas.
- Other liquid Forex pairs where established H4, daily, and weekly levels can remain relevant for several sessions.
Trading Styles
- Swing trading on H4 and D1, with weekly levels used for broader market structure.
- Position-style analysis using D1 and W1 support and resistance.
- Intraday trading on M15 and H1 using H4 and daily levels as reference points.
- Breakout trading when price approaches an established higher-timeframe boundary.
- Scalping is possible, but the indicator is less suited to fast M1 and M5 strategies because its main strength comes from higher-timeframe levels.
How traders use it
A common approach is to start with the higher timeframes and then move down to the preferred entry chart.
For example, a swing trader could examine the weekly and daily levels first, then use H4 price action to determine whether price is respecting a major support or resistance area.
Suppose GBPUSD approaches a daily support level while an H4 support level is positioned nearby.
The overlapping levels create an area worth monitoring for a reaction.
If price forms a bullish reversal pattern in that area, additional confirmation can come from RSI, MACD, Fibonacci levels, or other price-action techniques.
The same process can be applied to resistance.
When price approaches a daily or weekly resistance level, a trader can monitor whether the market rejects the area or breaks through it with sustained momentum.
A confirmed breakout can then be evaluated as a possible continuation setup.
Get Instant Free Access
Indicator Settings
- SHOW_H1: Enables or disables the H1 support and resistance levels.
- SHOW_H4: Displays or hides H4 support and resistance levels.
- SHOW_D1: Controls the display of daily support and resistance.
- SHOW_W1: Displays or hides the weekly support and resistance levels.
- Colors: Controls the colors used for the plotted levels.
- Line Style: Adjusts the visual style of the support and resistance lines.
Important Notes
- The indicator is particularly well suited to swing trading because its main purpose is to display higher-timeframe levels.
- It is less effective as a standalone scalping tool on M1 and M5 charts because higher-timeframe support and resistance may be too distant for very short-term setups.
- A support or resistance line is an area for analysis, not a guaranteed reversal point.
- When levels from several timeframes meet around the same price, that area can be given additional attention.
- Combine the levels with price action or other technical confirmation when defining entries, stop-loss placement, and profit targets.