
The Shved Supply and Demand Indicator for MT4 automatically identifies and draws key supply and demand zones directly on the price chart.
These zones represent areas where strong buying or selling pressure previously caused significant price movements.
This support and resistance indicator highlights these zones and classifies them based on how often price has interacted with them, giving traders a structured view of market structure and liquidity areas.
Why traders use the Shved Supply and Demand Indicator
Traders use this indicator because it visualizes where major order flow imbalances have occurred in the past.
These areas often act as turning points where price reacts strongly, making them useful for planning entries, exits, and stop-loss placement.
The indicator is especially valuable for identifying whether a zone is weak, untested, verified, or proven.
Untested zones often attract price for the first time after a strong move, while verified and proven zones show repeated reactions and higher reliability.
Turncoat zones, on the other hand, can flip from support to resistance or vice versa after a breakout, offering potential reversal opportunities.
Download This MT4 Indicator for Free
Indicator Chart Setup
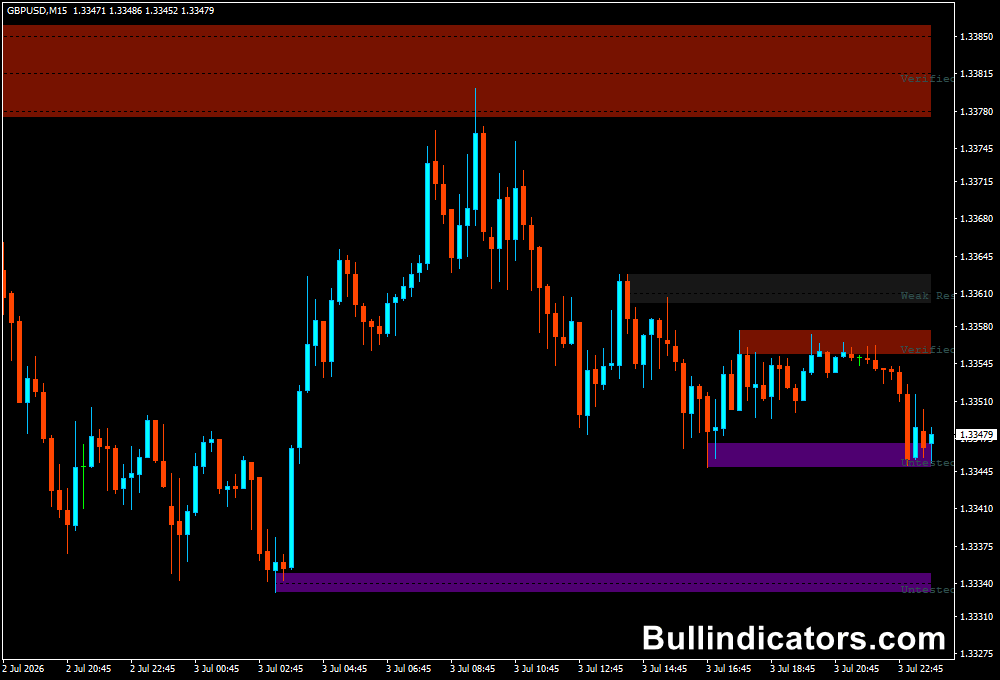
Once applied to MetaTrader 4, the indicator draws colored supply and demand zones directly on the main price chart.
Each zone includes a label explaining its type and strength.
Weak zones indicate minimal reaction, while stronger zones show repeated price interaction.
Fractals can be displayed to help identify swing points used in zone construction.
As price develops, zones remain visible to help traders track historical liquidity areas.
Core Features
- Automatic supply and demand zone detection
- Classification of zones (weak, untested, verified, proven, turncoat)
- Fractal-based swing identification
- Visual zone labeling on the chart
- Alert system for zone interaction
- Push notification support for mobile trading
Best for
- Identifying high-probability reversal zones
- Trading institutional supply and demand areas
- Planning entries around market structure
- Setting logical stop-loss levels
- Combining with price action strategies
Best Markets
- Major Forex pairs such as EUR/USD, GBP/USD, and USD/JPY where liquidity creates clear zones
- Volatile cross pairs such as GBP/JPY, EUR/JPY, and AUD/JPY
- Gold (XAU/USD) where strong institutional supply and demand levels often form
- Stock indices such as NASDAQ 100, S&P 500, and DAX 40 during active trading sessions
- Energy and commodity CFDs such as Brent Crude and WTI Oil
Trading Styles
- Scalping around intraday supply and demand reactions
- Day trading based on fresh zone retests
- Swing trading from higher timeframe zones
- Breakout and reversal trading from zone breaks or rejections
- Trend continuation trading using zone retests in the direction of momentum
How traders use it
Traders typically wait for price to return to a marked supply or demand zone before looking for confirmation entries.
In an uptrend, demand zones are used to find BUY opportunities, while in downtrends, supply zones are used for SELL setups.
Stop-loss orders are often placed just outside the zone boundary to protect against false breakouts.
A common strategy is combining the Shved Supply and Demand Indicator with the 50 EMA.
When price is above the 50 EMA, traders focus only on demand zones for long entries.
When price is below the 50 EMA, attention shifts to supply zones for short trades.
For example, if price retraces into a demand zone while still above the 50 EMA, traders wait for bullish confirmation such as a rejection candle before entering a BUY trade.
This alignment helps filter lower-quality setups and keeps trades in the direction of the dominant trend.
Get Instant Free Access
Indicator Settings
- Zone Show Weak: Displays or hides weak supply and demand zones.
- Zone Show Untested: Enables visibility of newly formed, untested zones.
- Fractals Show on Chart: Displays fractal points used for zone construction.
- Zone Solid: Sets zones to appear as solid filled areas for better visibility.
- Show Alerts: Enables on-chart alerts when price enters a zone.
- Push Alerts: Sends notifications to the MetaTrader mobile app.
- Colors: Customizes the appearance of supply and demand zones.
Important Notes
- Stronger zones form after repeated price reactions.
- Higher timeframe zones are generally more reliable.
- Combine zones with trend filters such as moving averages for better accuracy.
- Avoid trading weak zones without additional confirmation.
- Price action confirmation improves entry timing significantly.









