
The Swing Point Highs and Lows indicator for Metatrader 4 is a technical analysis tool designed to identify important turning points in the market.
It automatically highlights recent swing highs and swing lows, helping traders understand where price momentum may be changing.
The indicator combines major and minor swing points with a moving average filter to provide a clearer view of market structure.
By identifying areas where buyers or sellers previously controlled price, traders can plan potential entries, stop-loss locations, and profit targets more effectively.
This tool can be applied to different trading approaches, including scalping, intraday trading, and swing trading.
It works particularly well when combined with price action confirmation or additional entry tools to avoid taking trades against the overall market direction.
Why traders use the Swing Point Highs and Lows Indicator
Market swings reveal important information about price behavior.
Higher highs and higher lows often indicate bullish momentum, while lower highs and lower lows can signal bearish pressure.
The Swing Point Highs and Lows Indicator helps traders visualize these movements without manually marking every turning point.
The included EMA provides additional trend confirmation by filtering short-term market noise.
This can be useful during volatile sessions where price creates many small movements that may lead to unreliable signals.
Many traders combine swing analysis with other confirmation methods.
For example, a scalper may use the swing points to identify the market direction and then combine them with an arrow-based entry indicator on M1 or M5 charts.
A blue arrow can confirm a BUY setup after a swing low forms, while a red arrow can support a SELL setup after a swing high develops.
Download This MT4 Indicator for Free
Indicator Chart Setup
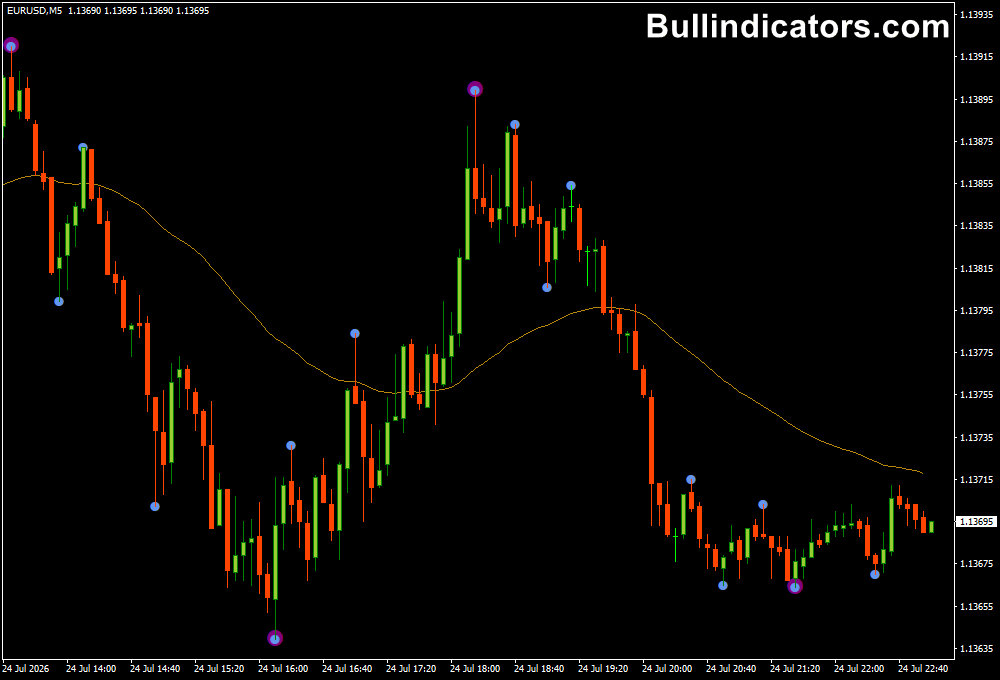
The indicator appears directly on the price chart and marks significant swing areas with colored circles.
Major swings are displayed separately from minor swings, allowing traders to distinguish between important market turning points and smaller price fluctuations.
A moving average line is also included to help determine the broader trend direction.
When swing signals appear in agreement with the moving average, traders often consider these setups stronger because momentum and market structure are aligned.
For example, a bullish setup may develop when price creates a swing low above the moving average and begins moving higher.
A bearish setup can occur when a swing high forms below the moving average and selling pressure increases.
Core Features
- Automatically detects swing highs and swing lows.
- Displays major and minor market turning points.
- Includes EMA trend confirmation.
- Helps identify potential reversal areas.
- Useful for support and resistance analysis.
- Works on all MetaTrader 4 timeframes.
- Suitable for manual trading strategies.
Best for
- Market structure analysis.
- Finding reversal zones.
- Trend continuation setups.
- Scalping confirmation.
- Support and resistance trading.
- Multi-timeframe strategies.
Best Markets
- EUR/USD for clean technical swing movements.
- GBP/JPY for larger price swings and volatility.
- USD/JPY during strong directional trends.
- Gold (XAU/USD) for identifying major turning points.
- US30 and NASDAQ index markets.
- Major Forex pairs during London and New York sessions.
Trading Styles
- M1 and M5 scalping with additional entry confirmation.
- M15 momentum trading.
- H1 intraday setups.
- H4 swing trading.
- Daily market structure analysis.
- Price action-based strategies.
How traders use it
A simple approach is to use the swing points to identify where price may react and then wait for confirmation before entering a trade.
Example BUY setup:
- A swing low circle appears after a temporary market decline.
- Price remains above the EMA, showing bullish market conditions.
- A confirmation signal appears, such as a bullish candle pattern or a blue buy arrow from an entry indicator.
- A BUY trade is opened with a stop-loss below the recent swing low.
- The profit target can be placed near the next swing high or resistance zone.
For scalping, traders can combine the Swing Point Highs and Lows Indicator with an entry signal tool on M1 and M5 charts.
For example, the swing indicator can define the market structure, while the Forex Entry Indicator provides the exact timing.
A blue arrow can be used as a BUY confirmation, while a red arrow can indicate a SELL opportunity.
SELL setups follow the opposite logic.
Traders look for a recent swing high, confirmation that sellers are taking control, and an entry signal before opening a short position.
The stop-loss is commonly placed above the swing high, while the target can be based on the next swing low.
Using multiple timeframes can improve analysis.
A trader may identify major swing direction on H1 or H4 and then move to M15 or M5 to find a more precise entry.
Get Instant Free Access
Indicator Settings
- MajorSwingColor: Changes the color of the major swing circles.
- MajorSwingSize: Defines the size of the major swing markers.
- PeriodsInMajorSwing: Determines the calculation period for major swings.
- MinorSwingColor: Changes the color of minor swing circles.
- MinorSwingSize: Controls the size of minor swing markers.
- Colors: Adjusts the visual appearance of the indicator.
Important Notes
- Swing points should be combined with trend analysis for better results.
- Lower timeframes may produce more frequent but weaker signals.
- Higher timeframe swing levels generally carry more importance.
- Confirmation from price action can improve entry accuracy.
- The EMA helps filter trades during uncertain market conditions.
- No technical tool can guarantee profitable trades in every market situation.
- Always use appropriate risk management with swing-based strategies.









