
The Ultimate Trend Signals V2 indicator for Metatrader 4 is a trend analysis tool that combines ADX calculations with pivot levels to identify potential trading opportunities.
It provides clear BUY and SELL arrows directly on the chart while also displaying information about market direction and trend strength.
By combining momentum analysis with important daily price levels, the tool helps traders understand whether the market has enough strength to support a continuation move.
The visual signals make it easy to follow developing trends, while experienced users can combine the information with their own strategies, such as price action, support and resistance, or automated trading systems.
Why traders use the Ultimate Trend Signals V2 Indicator
Finding the direction of the market is one of the most important parts of technical analysis.
This trading tool simplifies the process by showing whether conditions are favorable for bullish or bearish movements.
Blue arrows highlight possible buying opportunities, while red arrows identify potential selling conditions.
The addition of trend strength information helps avoid taking trades when momentum is weak.
The built-in pivot levels also provide useful reference points for planning entries, exits, and stop-loss placement.
This combination makes the tool useful for traders who prefer visual signals while still allowing room for deeper technical analysis.
Download This MT4 Indicator for Free
Indicator Chart Setup
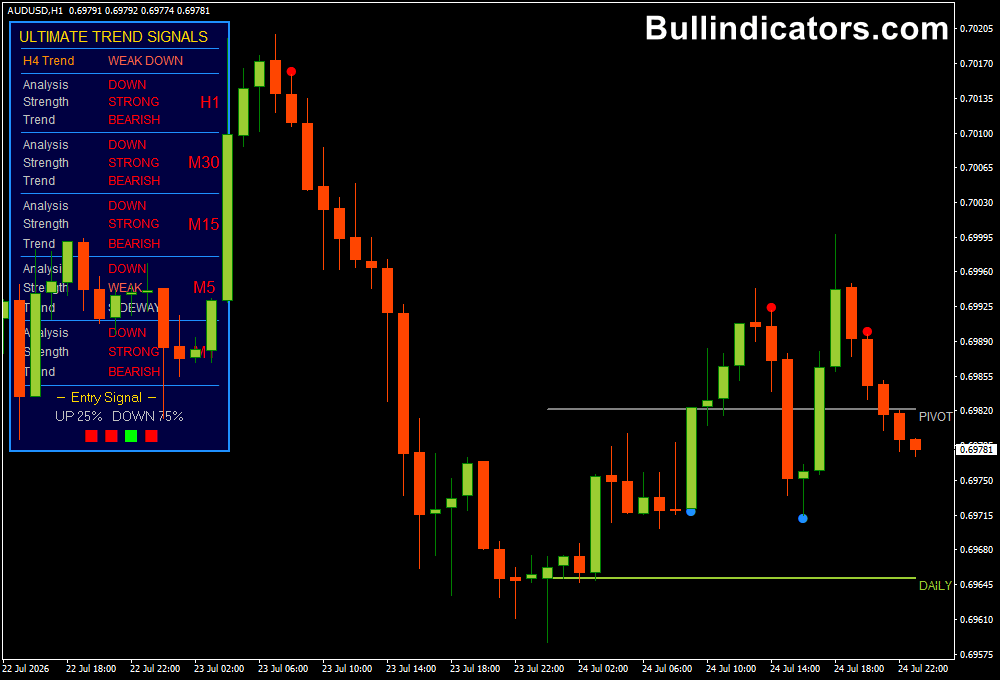
The Ultimate Trend Signals V2 displays directional arrows directly on the price chart.
Blue arrows indicate bullish momentum, while red arrows represent bearish conditions.
The chart also shows daily pivot information and the current market trend status.
The indicator can be applied to multiple timeframes, allowing users to analyze the larger market direction first and then search for entries on a lower timeframe.
For example, a trader may identify a strong H4 trend and use M15 or M30 signals for more precise execution.
Core Features
- BUY and SELL arrow signals displayed on the chart.
- Uses ADX-based trend strength analysis.
- Includes daily pivot level information.
- Shows bullish and bearish market direction.
- Supports multi-timeframe trading analysis.
- Provides customizable alerts.
- Suitable for manual and automated trading approaches.
Best for
- Trend-following strategies.
- Momentum-based trading.
- Breakout confirmation.
- Multi-timeframe analysis.
- Following strong directional moves.
- Combining signals with other technical methods.
Best Markets
- GBP/USD and EUR/USD during strong London session trends.
- EUR/JPY and GBP/JPY when momentum expands after consolidation.
- Gold (XAUUSD) during high-volatility price movements.
- NASDAQ and US30 index trading.
- USD/JPY around major daily pivot reactions.
- Major Forex pairs with clear directional movement.
Trading Styles
- M5 and M15 momentum scalping.
- M30 intraday trend setups.
- H1 day trading strategies.
- H4 swing trading using stronger signals.
- Breakout trading after consolidation periods.
- Multi-timeframe trend confirmation.
How traders use it
A common method is to wait for a new arrow signal while checking whether the trend strength supports the direction.
A blue arrow combined with increasing bullish momentum can indicate a potential buying opportunity, while a red arrow with strengthening bearish pressure may suggest a selling setup.
Many users combine the signals with additional confirmation.
For example, a BUY arrow near a support zone or above a major moving average can provide stronger evidence of a possible continuation move.
Similarly, traders may use pivot levels as potential targets or areas where price could react.
Stop-loss placement is often based on recent swing points.
For a BUY setup, a stop-loss can be positioned below the previous swing low, while SELL positions can use the previous swing high as protection.
Some traders exit when an opposite arrow appears or when trend strength starts weakening.
Get Instant Free Access
Indicator Settings
- Show_CentralPIVOT_Only: Displays only the central pivot point while hiding additional pivot levels.
- SHIFT_CentralPIVOT_Only_TEXT: Adjusts the position of the pivot text on the chart.
- CentralPivot_FontSize: Changes the size of the pivot label.
- CentralPivot_Font: Selects the font used for pivot information.
- Arrow_Indicator: Enables or disables the BUY and SELL arrows.
- ADXbars: Determines the number of bars used for ADX calculations.
- Bars_Counted: Sets the number of historical candles used in calculations.
- AlertOn: Enables alert notifications when new signals appear.
Important Notes
- Higher timeframe signals generally provide stronger trend confirmation.
- H1 and H4 charts are useful for identifying the main market direction.
- M5 and M15 charts can be used for faster entries during active sessions.
- Arrow signals should be confirmed with price action or additional technical analysis.
- Pivot levels can help identify potential reaction zones and profit targets.
- Strong trends usually produce better results than sideways market conditions.
- Always apply proper risk management when following automated or manual signals.









