
The Waddah Attar Explosion MTF indicator for MT4 combines trend direction and momentum strength in one practical chart tool.
Its histogram changes color to show bullish or bearish pressure, while the explosion line provides a threshold for identifying stronger momentum conditions.
Green bars indicate increasing bullish pressure, while red bars highlight bearish movement.
The relationship between the histogram and threshold helps distinguish active market conditions from periods where momentum is limited.
Why traders use the Waddah Attar Explosion MTF Indicator
The main advantage is the clear visual representation of momentum.
Expanding histogram bars can highlight increasing buying or selling pressure, while movement beyond the explosion threshold provides additional confirmation that the market has sufficient strength.
This makes the tool useful for trend-following, momentum and intraday scalping strategies.
It can also help filter out weaker conditions, particularly when the threshold remains flat and histogram activity stays below it.
Download This MT4 Indicator for Free
Indicator Chart Setup
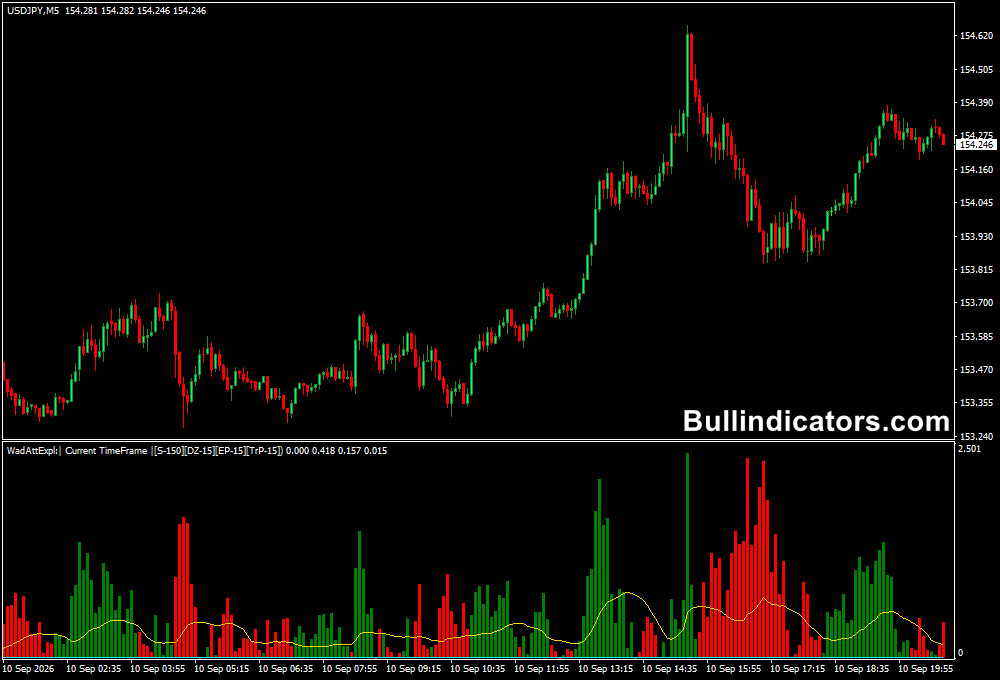
The indicator appears in a separate window below the price chart.
Green and red histogram bars display the current directional pressure, while the explosion line acts as a momentum threshold.
Strong bullish conditions are typically represented by expanding green bars above the threshold.
Bearish conditions are shown through expanding red bars crossing above the threshold.
Weak histogram activity below the line can signal a ranging or indecisive market.
Core Features
- Color-coded bullish and bearish momentum histogram
- Explosion threshold for momentum confirmation
- Multi-timeframe functionality
- Visual trend-strength analysis
- Customizable alerts and display colors
- Works across all MT4 timeframes
Best for
- Momentum confirmation
- Trend continuation entries
- Filtering low-momentum conditions
- Intraday market analysis
- Supporting price-action strategies
Best Markets
- EURUSD and GBPUSD during active London and New York sessions
- GBPJPY and EURJPY for faster intraday price movements
- XAUUSD when strong momentum develops
- Major forex pairs with consistent liquidity and movement
Trading Styles
- Scalping on M1 and M5
- Intraday trading on M15 and H1
- Trend-following on H1 and H4
- Momentum breakout strategies
- Multi-timeframe confirmation
How traders use it
A bullish setup can be considered when green histogram bars progressively increase and move above the explosion threshold.
For bearish conditions, traders look for expanding red bars crossing above the threshold.
The signal can then be combined with market structure, support and resistance or price action to determine the entry.
A stop loss can be placed beyond a recent swing point, while weakening histogram momentum or a color change can be used as part of the exit decision.
Extra caution is appropriate when the threshold is flat and histogram bars remain below it. Such conditions often indicate insufficient momentum for a trend-based setup.
M5 USDJPY Scalping Example
A practical way to combine the Waddah Attar Explosion MTF with the Super Signal v3 Scalper is to use one for momentum confirmation and the other for the entry trigger.
On an M5 USDJPY chart, the Waddah Attar Explosion can help determine whether the current move has enough momentum, while the Super Signal v3 marks potential scalp entries with colored arrows.
How this scalper strategy works:
- Green arrow: A green arrow from the Super Signal v3 represents a potential BUY scalp.
- Yellow arrow: A yellow arrow represents a potential SELL scalp.
- BUY confirmation: When a green arrow appears while the Waddah Attar histogram is expanding in green and moving above the explosion threshold, bullish momentum has stronger confirmation.
- SELL confirmation: When a yellow arrow appears while the histogram is expanding in red and moving above the threshold, bearish momentum is gaining support.
- Entry timing: The arrow can be used as the short-term trigger, while the Waddah Attar display helps confirm that momentum supports the direction.
- Trade management: A stop loss can be positioned beyond the recent M5 swing high or low, with the target based on current USDJPY volatility and nearby price levels.
- Signal filtering: If the histogram is weak or remains below a flat threshold, it is preferable to wait rather than act on every arrow.
- Market conditions: USDJPY M5 setups are particularly interesting during active London and US sessions, when price movement and liquidity are generally higher.
This combination creates a simple two-step approach: the Super Signal v3 identifies the scalp direction, while Waddah Attar Explosion provides momentum confirmation.
The strongest setups occur when both tools point in the same direction and price action supports the signal.
Get Instant Free Access
Indicator Settings
- Sensitive: Controls the responsiveness of the calculation to price movement.
- Dead Zone Pip: Defines the height of the dead-zone area in pips.
- Explosion Power: Sets the explosion power level used for alert conditions.
- Trend Power: Defines the trend-strength level for alerts.
- Alerts: Controls available alert notifications.
- Colors: Adjusts the colors used in the display.
Important Notes
- Green bars represent bullish pressure and red bars represent bearish pressure.
- Stronger signals generally develop when histogram bars expand beyond the threshold.
- Flat threshold conditions with weak bars can indicate market indecision.
- Use appropriate stop-loss and position-sizing rules.
- Combine momentum signals with broader market analysis before entering a trade.









