
The VWAP Bands indicator for MT5 combines Volume Weighted Average Price with standard deviation bands to create a practical framework for evaluating where price is trading relative to its estimated fair value.
Unlike a conventional moving average, VWAP places greater weight on trading volume, making the central line useful for assessing the price level at which significant market activity has occurred.
The indicator displays a central VWAP line together with upper and lower deviation bands.
These bands expand around the fair-value area and can help identify prices that have moved substantially away from the VWAP.
This makes the tool useful for locating potential support and resistance zones, assessing market extensions, and planning entries and exits around relative value.
Why traders use the VWAP Bands Indicator
VWAP provides a reference point for determining whether the current market price is relatively high or low compared with its volume-weighted average.
The surrounding bands add another layer by showing how far price has moved from that reference.
This combination can be particularly useful when price reaches an outer band after a strong directional move.
Rather than treating every band touch as an automatic reversal, traders can study price action around the level and determine whether the market is rejecting the extension or continuing to move away from fair value.
The indicator also provides a useful framework for the classic buy-low and sell-high concept.
Lower bands can highlight areas where price is trading significantly below VWAP, while upper bands identify increasingly elevated prices relative to the central reference.
Download This MT5 Indicator for Free
Indicator Chart Setup
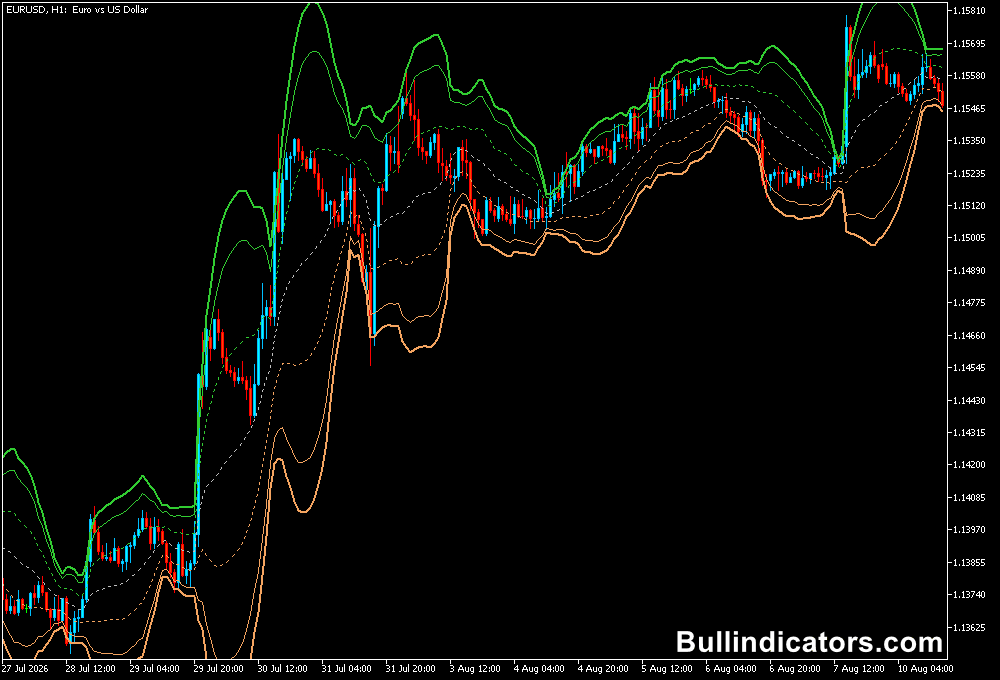
The chart contains a central VWAP line surrounded by multiple deviation bands.
The middle line represents the volume-weighted fair-value reference, while the upper and lower bands are calculated from standard deviation.
Depending on the selected deviation values, the chart can display several levels above and below VWAP.
The outer bands are particularly useful for identifying extended price conditions.
In contrast, the inner bands can help assess whether price is moving gradually away from fair value or accelerating toward an extreme.
Core Features
- Volume Weighted Average Price reference line.
- Multiple upper and lower deviation bands.
- Volume-sensitive calculation for fair-value analysis.
- Dynamic areas for potential support and resistance.
- Useful for identifying stretched price conditions.
- Applicable to intraday and higher-timeframe analysis.
- Supports analysis of price movement around fair value.
Best for
- Identifying potential overextended price levels.
- Finding areas where price may return toward VWAP.
- Assessing dynamic support and resistance.
- Planning entries after strong price extensions.
- Setting profit objectives around the VWAP or opposing bands.
- Combining volume-weighted analysis with price action.
Best Markets
- EURJPY and GBPJPY for active intraday price movement.
- EURUSD and GBPUSD for liquid forex sessions.
- Gold (XAUUSD) when analyzing strong intraday expansions.
- Major currency pairs during London and New York trading hours.
- Other liquid instruments where volume activity provides useful context.
Trading Styles
- Scalping on M1 and M5 charts around extreme VWAP bands.
- Intraday trading on M15 and H1 using VWAP as the central value reference.
- Mean-reversion strategies targeting a return toward the middle VWAP line.
- Pullback trading when price returns from an outer band toward fair value.
- Multi-timeframe analysis using H1 or H4 for context and lower charts for entry timing.
How traders use it
The VWAP Bands Indicator works best when the bands are treated as areas for analysis rather than automatic buy and sell signals.
Price reaching an extreme band shows that the market has moved considerably away from fair value, but confirmation from price action can help determine whether that movement is likely to continue or retrace.
For a mean-reversion approach, traders monitor the outer bands for signs that an extended move is losing momentum.
A rejection from the lower band can support a bullish setup, while rejection from the upper band can support a bearish setup.
The VWAP line can then serve as a potential profit objective as price moves back toward fair value.
How to maximize profit?
To maximize the profit potential from the indicator, the focus should be on improving entry location rather than simply increasing trade frequency.
Entries close to an extreme band can offer a more favorable distance to the VWAP or opposing band, provided price action confirms the setup.
Risk can also be defined beyond the recent swing point, keeping the potential reward relative to the risk under control.
Another approach is to use the VWAP as a directional filter.
When price remains above the middle line and repeatedly finds support around VWAP or the lower bands, bullish conditions may have greater relevance.
Persistent trading below VWAP can provide the opposite context. This helps avoid treating every extreme reading as a reversal opportunity.
Volume has an important role in the indicator’s behavior.
During active sessions with stronger volume, VWAP and its bands can provide more meaningful information about current market participation.
During quieter periods, price may move differently and band reactions can be less decisive.
Get Instant Free Access
Indicator Settings
- Use real volume? – Determines whether the calculation uses real trading volume when available. The default setting is false.
- Deviation with sample correction? – Controls the type of deviation calculation used by the indicator. The default setting is false.
- First band(s) deviation – Sets the standard deviation value used to calculate the first upper and lower bands.
- Second band(s) deviation – Defines the deviation value for the second set of bands.
- Third band(s) deviation – Determines the standard deviation calculation for the third and outermost band.
Important Notes
- VWAP represents a reference for volume-weighted fair value and should not be treated as a guaranteed reversal level.
- Extreme bands can remain stretched during strong trends.
- Price action confirmation is useful before entering against a strong directional move.
- The indicator can be particularly informative during periods of elevated market activity.
- Higher-timeframe VWAP analysis can provide useful context for lower-timeframe entries.
- Risk management remains essential when trading from outer bands because price can continue beyond an initial deviation level.









