
The 1-2-3 Pattern indicator for MT4 is a price action analysis tool that automatically identifies the popular 1-2-3 reversal pattern on the chart.
This price action pattern is widely used because it helps locate potential trend changes and important turning points in the market.
The indicator combines a non-repainting ZigZag pattern with Fibonacci levels to highlight possible entry areas, exit points, and support and resistance zones.
By displaying the three key points of the formation, it provides a visual representation of changing market structure.
This indicator is suitable for users who follow price action strategies and want assistance identifying patterns without manually drawing swing points and Fibonacci levels.
Why traders use the 1-2-3 Pattern Indicator
The 1-2-3 pattern is a well-known market formation that often appears near the end of trends.
It helps identify situations where momentum may be weakening and a potential reversal could develop.
The indicator simplifies the process by automatically marking the three important points of the pattern.
These include the initial high or low, the entry area, and the Fibonacci target levels.
This allows users to quickly evaluate possible trading opportunities.
The built-in Fibonacci levels add another layer of analysis by highlighting areas where price may find support or resistance.
This combination of pattern recognition and Fibonacci measurements makes the indicator useful for both reversal and continuation strategies.
Download This MT4 Indicator for Free
Indicator Chart Setup
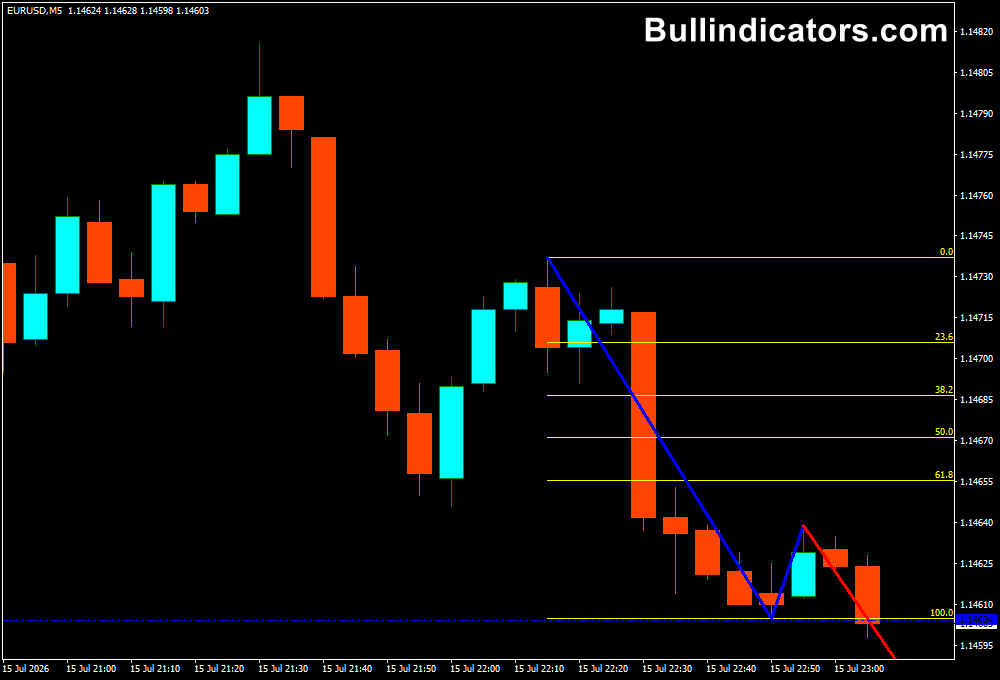
When applied to a MetaTrader 4 chart, the 1-2-3 Pattern Indicator draws a three-point ZigZag formation that represents the current price action structure.
The pattern helps visualize possible trend exhaustion and new directional moves.
The indicator also displays Fibonacci levels around the pattern.
These trading levels can act as potential support and resistance areas where price may react during a trade setup.
During bullish conditions, the indicator highlights upward patterns, while bearish market conditions are displayed with downward signals.
The visual changes help identify possible trend transitions.
Core Features
- Automatically detects 1-2-3 price action patterns
- Uses ZigZag analysis to identify important swing points
- Includes Fibonacci support and resistance levels
- Displays potential entry and exit areas
- Helps analyze trend reversals and continuation moves
- Works on different timeframes and trading markets
Best for
- Finding potential trend reversal setups
- Analyzing market structure through price action
- Trading Fibonacci-based support and resistance areas
- Identifying possible entry and exit points
- Building pattern-based trading strategies
Best Markets
- Major forex pairs such as EUR/USD, GBP/USD, and USD/JPY
- Volatile pairs like GBP/JPY for reversal opportunities
- Gold (XAU/USD) where Fibonacci levels often influence price reactions
- Major indices including NASDAQ and DAX
- Cryptocurrency markets with strong directional movements
Trading Styles
- Price action trading using reversal patterns
- Scalping on M5 to M30 charts
- Day trading with intraday trend changes
- Swing trading using higher timeframe patterns
- Fibonacci-based trading strategies
How traders use it
The 1-2-3 Pattern Indicator is commonly used by waiting for the formation to complete before entering a position.
The three-point structure helps identify where a trend may lose momentum and where a new move could begin.
During an uptrend, the indicator may display a bullish pattern and suggest possible buying opportunities.
A common approach is to wait for confirmation, enter near the indicated area, and place a stop loss below the recent swing low.
During a downtrend, the indicator can highlight bearish formations.
A short position may be considered after confirmation, with protection placed above the recent swing high.
The Fibonacci levels can be used for managing trades.
Lower Fibonacci areas may act as support during bullish setups, while higher levels can become resistance during bearish movements.
Profit targets can be based on these levels or a predefined risk-to-reward ratio.
Get Instant Free Access
Indicator Settings
- Fibo_Mode: Defines the operating mode of the Fibonacci lines. Default value is 1.
- Enable_Target: Controls the target line feature. Default value is 1.
- Fibo_Target: Sets the Fibonacci target level value. Default value is 1.618.
- Pattern_High: Changes the color used for price high patterns.
- TradeLine_High: Adjusts the color of high trade lines.
- Pattern_Low: Changes the color used for price low patterns.
- TradeLine_Low: Adjusts the color of low trade lines.
Important Notes
- The 1-2-3 pattern should be confirmed with market context before entering trades.
- Fibonacci levels represent possible reaction areas, not guaranteed turning points.
- The indicator works best when combined with price action confirmation.
- Different markets may require different timeframe selection and risk settings.
- Proper trade management is essential when using reversal-based strategies.









