
The Brilliant Reversals Indicator for MT4 is a technical analysis tool designed to identify potential turning points in the currency market.
It analyzes historical price behavior and compares current conditions with previous movements to highlight areas where a trend reversal may develop.
Market reversals often occur after momentum weakens, price reaches important support or resistance areas, or recognizable candlestick formations appear.
However, identifying these moments manually can be challenging because financial markets are constantly changing.
The Brilliant Reversals indicator simplifies this process by displaying visual reversal signals directly on the MetaTrader 4 chart.
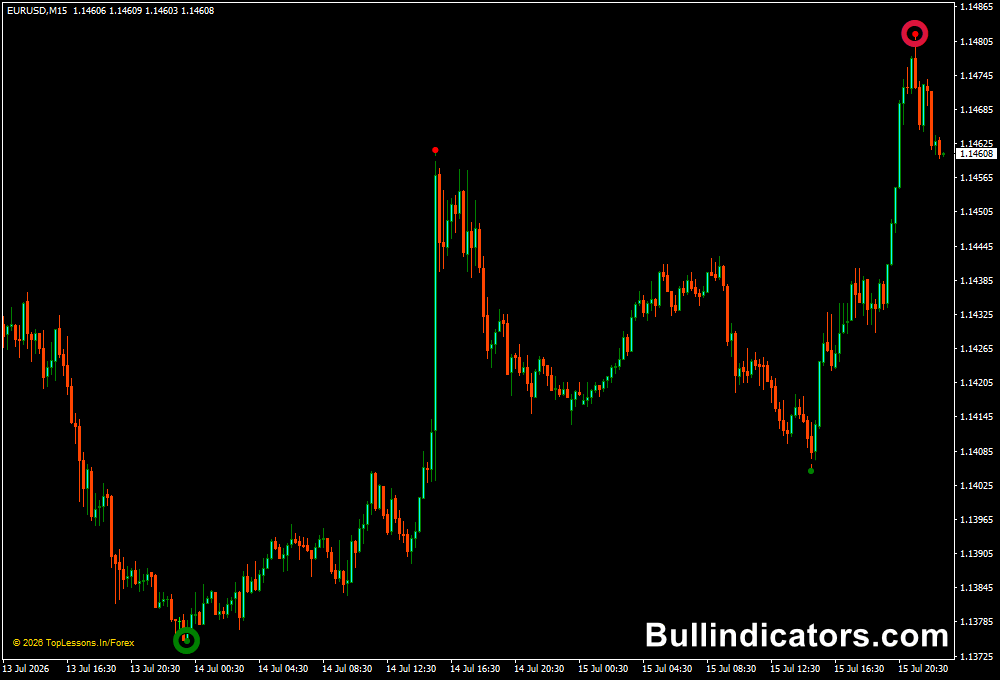
Green and red dots indicate possible bullish and bearish turning points, helping users locate potential trading opportunities faster.
Why traders use Brilliant Reversals Indicator
Trend reversals can offer some of the most attractive trading opportunities because they allow market participants to enter early in a new directional move.
The challenge is separating genuine reversals from temporary price corrections.
The Brilliant Reversals Indicator helps by highlighting possible reversal zones based on its analysis of previous price behavior.
The signals are displayed clearly on the chart, making it easier to monitor areas where momentum may be changing.
The indicator is also popular because it does not repaint signals after they appear, allowing users to review historical setups and evaluate market reactions more accurately.
Many users combine the signals with additional confirmation methods such as candlestick patterns, support and resistance levels, or price action analysis.
For example, a bullish reversal dot followed by a bullish engulfing candle can provide stronger confirmation for a potential long setup.
Download This MT4 Indicator for Free
Indicator Chart Setup
After applying the Brilliant Reversals indicator to a MetaTrader 4 chart, colored dots appear near price action to show possible reversal areas.
Green dots represent potential bullish changes, while red dots indicate possible bearish reversals.
This technical tool can be used on different timeframes and markets.
Shorter timeframes may provide more frequent signals, while higher timeframes generally produce fewer but potentially stronger reversal areas.
The signals work best when combined with market context.
A reversal signal near a previous high, low, or important support and resistance zone can carry more significance than a signal appearing randomly in the middle of a price range.
Core Features
- Identifies potential bullish and bearish reversal zones
- Displays easy-to-read green and red signal dots
- Uses historical price analysis for signal calculation
- Designed as a non-repaint reversal indicator
- Works with multiple trading styles and timeframes
- Can be combined with candlestick confirmation methods
Best for
- Finding possible trend change areas
- Confirming reversal setups with price action
- Improving chart analysis efficiency
- Locating early entry opportunities
- Building reversal-based trading strategies
Best Markets
- EUR/USD and GBP/USD for liquid forex reversal setups
- GBP/JPY and EUR/JPY where strong price swings create reversal opportunities
- Gold (XAU/USD) for identifying momentum changes around key levels
- US indices such as NASDAQ and S&P 500 during volatile sessions
- Major cryptocurrency pairs where trend shifts can develop quickly
Trading Styles
- Scalping on M5 and M15 charts with additional confirmation
- Intraday trading using reversal zones during active sessions
- Swing trading based on H4 and daily reversal signals
- Price action strategies combined with candlestick patterns
- Counter-trend setups around important market levels
How traders use it
A common approach is waiting for the Brilliant Reversals Indicator to display a potential turning point and then looking for additional confirmation before entering a trade.
For a bullish setup, users typically wait for a green reversal dot to appear.
Confirmation may come from a bullish engulfing pattern, hammer candle, or another sign that buyers are gaining control.
A long position can then be considered with risk placed below the recent market low.
For bearish opportunities, a red reversal dot suggests possible selling pressure.
A bearish engulfing pattern or rejection candle can provide additional evidence that the market may move lower.
Stop loss placement is often positioned above the recent swing high.
The indicator can also be used with trend analysis.
Some users prefer taking reversal signals only when they appear near important support and resistance zones, while others combine them with moving averages or momentum tools for stronger filtering.
Get Instant Free Access
Indicator Settings
- Small_bar_count1: Defines the number of small candles used for signal calculation.
- Medium_bar_count1: Determines the number of medium-sized candles analyzed.
- Big_bar_count1: Controls the number of large candles considered during calculations.
- Colors: Allows customization of bullish and bearish signal colors.
- Styling: Adjusts the visual appearance of indicator elements on the chart.
Important Notes
- Reversal signals should always be evaluated within the overall market structure.
- No indicator can predict every market turning point with complete accuracy.
- Signals near strong support and resistance areas may provide better opportunities.
- Additional confirmation from price action can improve trade selection.
- Proper risk management remains important when trading reversal strategies.









