
The Extreme TMA Line indicator for MT5 uses a triangular moving average to smooth price fluctuations and display a central trend line together with upper and lower bands.
The bands can be used as dynamic support and resistance areas, while the color of the center line provides a quick indication of the prevailing market direction.
The central TMA line changes between green, red and yellow.
Green represents bullish conditions, red indicates bearish pressure, and yellow signals a neutral market where directional momentum is less convincing.
This combination allows the indicator to be used for both trend identification and entry timing.
ATR-based calculations determine the distance of the outer bands, allowing them to adapt to changing volatility.
The settings can also be adjusted for different trading styles, with shorter periods responding more quickly to intraday price movement.
Why traders use the Extreme TMA Line Indicator
The indicator combines trend information and volatility levels in a single chart tool.
The colored center line helps determine whether the market is moving upward, downward or through a period of indecision, while the surrounding bands provide reference points for potential reactions in price.
The yellow state is particularly useful as a filter.
Rather than forcing a position during a period of balanced buying and selling pressure, users can wait until the center line develops a more decisive green or red direction.
Download This MT5 Indicator for Free
Indicator Chart Setup
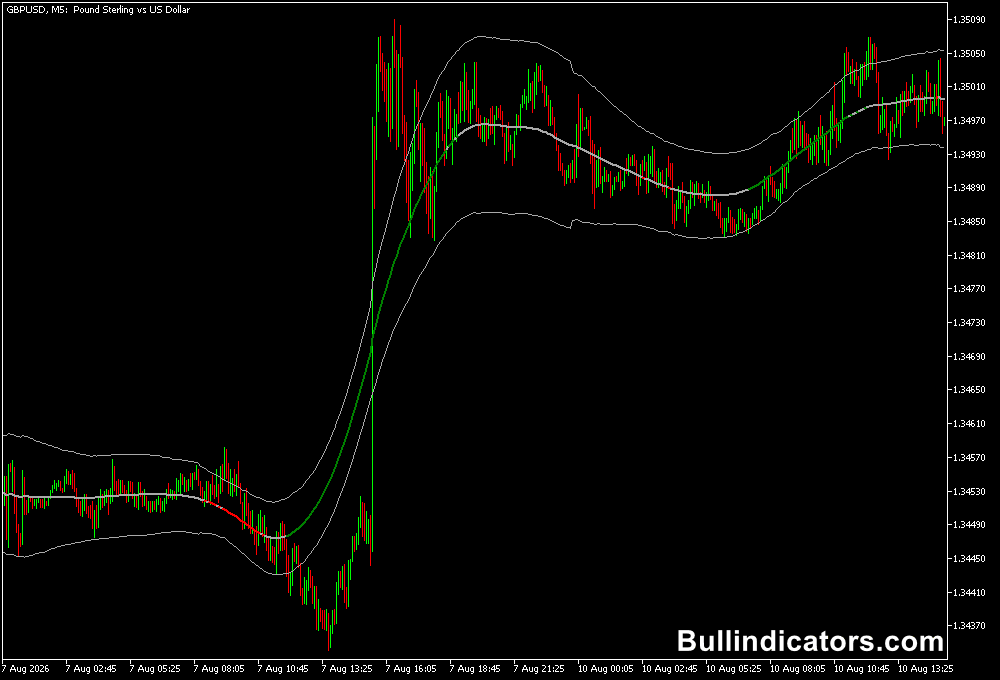
The indicator plots a central TMA line across the price chart with an upper and lower band surrounding it.
The bands expand and contract according to the ATR calculation, giving them a dynamic relationship with current market volatility.
The center line uses three colors.
Green identifies an upward trend, red signals a downward trend, and yellow represents a neutral phase.
Price interaction with the outer bands can provide additional context when deciding whether a trend signal has enough room to develop.
Core Features
- Triangular moving average-based trend calculation.
- Upper and lower volatility bands.
- Green center line for bullish conditions.
- Red center line for bearish conditions.
- Yellow center line for neutral conditions.
- ATR-based band calculation.
- Adjustable TMA and trend parameters.
- Suitable for multiple timeframes.
Best for
- Identifying the dominant short-term trend.
- Filtering trades during neutral market conditions.
- Using dynamic bands as support and resistance references.
- Trend-following entries after a color transition.
- Intraday pullback analysis.
Best Markets
- EURUSD can suit M5, M15 and H1 trend setups where liquidity is consistently high.
- GBPUSD offers useful opportunities on M15 and H1 when directional movement develops.
- USDJPY can work well for M15 trend-following during active sessions.
- Gold can be monitored on M15 and H1, with position size adjusted for its higher volatility.
- Major stock indices can also be suitable when the bands expand around a strong directional move.
Trading Styles
- M5 scalping with a shorter TMA period for faster responses.
- M15 intraday trend following on EURUSD or GBPUSD.
- H1 pullback trading using the center line as the directional filter.
- H4 swing trading when the TMA trend remains consistently colored.
- Band-based analysis around dynamic support and resistance.
How traders use it
A simple approach is to use the center line as the primary directional filter and the outer bands as additional price references.
Green conditions favor long setups, red conditions favor short positions, while yellow conditions can be treated as a period for observation rather than immediate entry.
Bullish Setup
- Wait for the center TMA line to become green.
- Allow the green trend to develop rather than entering during a brief color change.
- Look for price to hold above or recover from the middle line.
- A pullback toward the central TMA can provide a more controlled entry area.
- Place the stop below a recent swing low or relevant lower-band area.
- Consider closing the position when the center line changes color or bullish momentum clearly weakens.
Bearish Setup
- Wait for the center line to turn red.
- Let the bearish color establish itself before considering an entry.
- Look for price to remain below the central line.
- A retracement toward the TMA can provide an opportunity to join the declining move.
- Place the stop above a recent swing high or appropriate upper-band area.
- Exit when the center line changes color or the bearish move loses momentum.
EURUSD M15 Practical Example
Consider EURUSD on M15 after a period of sideways movement.
The Extreme TMA center line is initially yellow, so there is no strong directional signal.
Price then breaks upward and the center line changes to green.
Rather than entering immediately on the first color change, wait for the green line to remain established and for price to hold above the central TMA.
- Yellow conditions are ignored while the market lacks direction.
- The center line changes from yellow to green.
- EURUSD holds above the central TMA after a small pullback.
- A long entry can be considered when bullish momentum resumes.
- The stop can be placed below the pullback low.
- The upper band can act as a reference for potential resistance and profit management.
For a bearish variation, wait for the center line to turn red after a period of yellow conditions.
If EURUSD remains below the TMA and a pullback fails near the center line, a short entry can be considered once downward momentum resumes.
This approach avoids taking trades while the indicator is still neutral.
Get Instant Free Access
Indicator Settings
- TMAPeriod – sets the period used for the triangular moving average. The default value is 45.
- ATRPeriod – determines the ATR calculation period. The default value is 100.
- ATRMultiplier – controls the ATR multiplier used in calculating the band distance. The default value is 1.272.
- TrendThreshold – determines the threshold used to evaluate the trend. The default value is 0.5.
Important Notes
- Yellow conditions indicate a lack of strong directional momentum and can be used as a trade filter.
- The outer bands are dynamic and change as market volatility changes.
- Shorter TMA periods can produce faster signals but may also increase sensitivity to market noise.
- Color changes should be assessed together with price movement rather than treated as guaranteed reversal signals.
- Risk levels should be adapted to the timeframe, volatility and recent swing points.









