
The LuxAlgo Buyside & Sellside Liquidity indicator for MT5 is designed to highlight areas where clusters of pending orders and stop orders may influence price behavior.
By marking potential liquidity pools above recent highs and below recent lows, the indicator helps identify locations where price may accelerate, reverse, or briefly sweep a level before moving in the opposite direction.
Buyside liquidity is displayed around highs, while sellside liquidity is positioned beneath lows.
These zones can be particularly useful when analyzing market structure because a move into a liquidity area does not necessarily represent a genuine breakout.
Price may first collect available liquidity before establishing its next directional move.
The indicator can be used for scalping, intraday trading and swing analysis.
It can also complement strategies based on market structure, order blocks, support and resistance, and breakout confirmation.
Why traders use the Buyside & Sellside Liquidity Indicator
Traditional support and resistance analysis focuses primarily on where price has previously reacted.
Liquidity analysis adds another perspective by considering where stops and pending orders may be concentrated.
A recent swing high, for example, can attract buy stops from short positions as well as breakout orders.
The indicator automatically marks these potential areas, allowing the chart to show where a liquidity sweep may occur.
A buyside zone can become important when price pushes above a previous high and quickly rejects the area.
Similarly, a sellside sweep below a low can precede a bullish reaction if sellers fail to maintain the breakdown.
Download This MT5 Indicator for Free
Download “LuxAlgo – Buyside & Sellside Liquidity.ex5” Indicator
Indicator Chart Setup
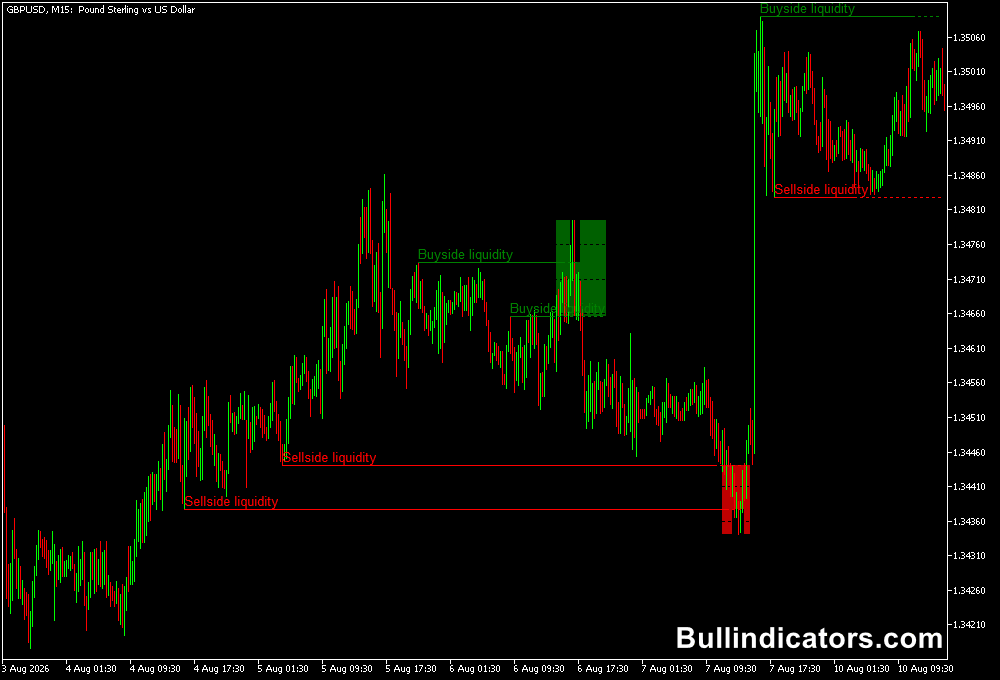
The chart displays liquidity zones around significant highs and lows.
Green areas identify potential buyside liquidity above price, while red areas mark possible sellside liquidity beneath the market.
The zones provide reference points rather than automatic buy and sell signals.
Their most useful application is often to watch how price behaves when one is reached.
A rapid rejection can suggest a sweep, while a decisive close through the area can indicate that price is accepting the new level and continuing the breakout.
Core Features
- Automatically identifies potential buyside liquidity zones.
- Marks sellside liquidity below significant lows.
- Green zones represent potential liquidity above highs.
- Red zones identify potential liquidity beneath lows.
- Optional liquidity void detection.
- Adjustable detection length.
- Controls for visible liquidity levels.
- Optional candle-close confirmation.
- Alert functionality for liquidity events.
Best for
- Identifying potential stop sweeps around swing highs and lows.
- Finding reversal areas after liquidity grabs.
- Confirming breakout and false-breakout scenarios.
- Mapping liquidity before entering a short-term position.
- Combining liquidity zones with market structure and order-flow concepts.
Best Markets
- Gold (XAUUSD) is particularly interesting because its intraday movements can quickly sweep visible highs and lows.
- EURUSD offers liquid conditions for studying liquidity behavior on M15 and H1.
- GBPUSD can produce sharp stop runs around London and New York session highs and lows.
- NAS100 and US30 can provide substantial liquidity movements for experienced index traders.
- USDJPY can be useful for studying session-based liquidity around established intraday ranges.
Trading Styles
- M5 scalping around nearby liquidity pools.
- M15 intraday reversal trading after confirmed sweeps.
- H1 market-structure analysis around major liquidity levels.
- London and New York session strategies focused on previous highs and lows.
- Swing trading using H4 liquidity zones as larger market reference points.
How traders use it
A common method is to wait for price to reach a marked liquidity area and then study the reaction.
The zone itself is not necessarily the entry.
Confirmation can come from a rejection candle, a market-structure shift, or a move back inside the previous trading range.
Gold M15 Buy Example
Consider XAUUSD on the M15 chart during an active trading session.
Suppose a red sellside liquidity zone has formed below a recent swing low.
Price then drops through that low and enters the red zone.
Rather than selling immediately into the breakdown, wait to see whether Gold can reclaim the level.
- A clearly defined sellside liquidity zone sits beneath a recent M15 low.
- Gold falls through the low and sweeps the red zone.
- The next M15 candle rejects the lower prices and closes back above the previous low.
- Price then breaks a nearby minor swing high, providing additional bullish confirmation.
- A long position can be considered after the reclaim and structure shift.
- Place the stop below the sweep low.
- Potential targets include the midpoint of the prior range, a nearby resistance level, or a buyside liquidity zone above price.
This example illustrates an important distinction: the sellside liquidity zone is used as an area of interest, not as an automatic buy signal.
The rejection and recovery provide the confirmation that sellers may have failed to maintain control.
Gold M15 Sell Example
For a bearish setup, suppose XAUUSD has a green buyside liquidity zone above a recent M15 high.
Gold rallies through that high and briefly trades inside the zone.
If the next candles reject the breakout and price falls back below the old high, the move can be interpreted as a potential buyside liquidity sweep.
- A green buyside zone is positioned above a recent M15 high.
- Gold pushes above the high and enters the liquidity area.
- The breakout fails and an M15 candle closes back below the previous high.
- A bearish break of a nearby short-term swing provides further confirmation.
- A short position can be considered after the failed breakout.
- Place the stop above the sweep high.
- A previous support level or sellside liquidity zone can provide a potential downside target.
Get Instant Free Access
Download “LuxAlgo – Buyside & Sellside Liquidity.ex5” for MT5
Indicator Settings
- Detection Length – determines how far back the indicator searches for liquidity zones.
- Buyside Liquidity Zones – enables the green liquidity areas above highs.
- Sellside Liquidity Zones – enables the red liquidity areas beneath lows.
- Liquidity Voids – optionally highlights areas representing price inefficiencies.
- Mode – controls how the indicator displays liquidity information, including the Present mode for active zones.
- Visible Levels – determines how many liquidity levels remain visible on the chart.
- Wait for candle close – confirms a level only after the candle has closed beyond the specified threshold.
- Alerts – enables available popup, email, sound or push notifications.
Important Notes
- A liquidity zone represents an area of interest and should not be treated as an automatic reversal signal.
- Strong breakouts can continue through a liquidity zone rather than reversing from it.
- Candle-close confirmation can help reduce reactions to temporary intrabar spikes.
- Combining liquidity sweeps with market structure can provide stronger entry confirmation.
- Gold can move rapidly around major liquidity areas, so stop placement and position size should reflect current volatility.









