
The RSI Heatmap indicator for MT5 is a currency strength analysis tool that uses the Relative Strength Index to compare the momentum of multiple currencies across different timeframes.
Rather than focusing on one chart at a time, the heatmap provides a broader view of which currencies are strengthening and which are losing momentum.
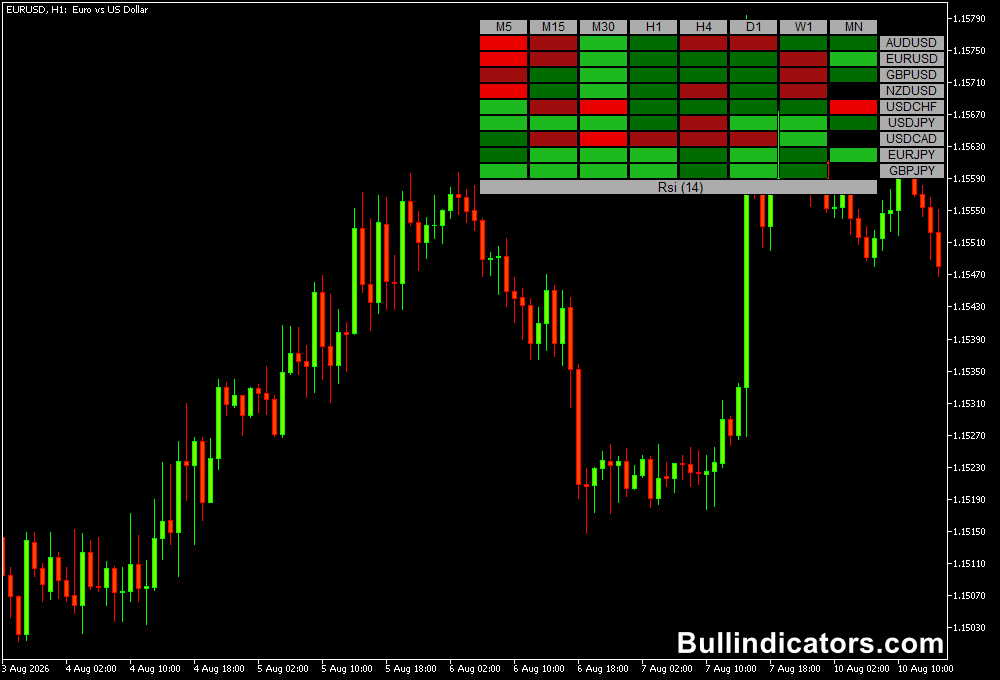
Different colors represent different levels of strength based on RSI values and price direction.
This makes it possible to scan several currencies and timeframes quickly, then select currency pairs where the relative strength difference is most pronounced.
The heatmap can be particularly useful when combined with a separate trend indicator.
For example, the Half Trend Indicator for MT5 can provide the directional bias on the selected currency pair, while the RSI Heatmap helps determine whether the underlying currencies support that direction.
Why traders use the RSI Heatmap Indicator
Currency strength can change significantly during an active Forex session.
A pair may be rising, but the move can be more convincing when the base currency is strengthening while the quote currency is simultaneously weakening.
The RSI Heatmap brings this information together in one display.
By checking several timeframes, users can distinguish a broad strength trend from a short-lived momentum burst.
This makes the tool useful for pair selection, trade confirmation and multi-timeframe analysis.
Download This MT5 Indicator for Free
Indicator Chart Setup
The RSI Heatmap displays multiple currency symbols across selected timeframes, with each cell assigned a color according to the calculated RSI strength.
Strong bullish and bearish readings receive different shades, while weaker conditions are represented by intermediate colors.
For example, a currency moving from green to light green indicates improving bullish strength.
A transition from firebrick toward red indicates increasing bearish pressure.
Comparing the same currency across several timeframes can reveal whether the momentum is broad or limited to a single period.
Core Features
- RSI-based currency strength calculation.
- Multiple currency pairs displayed in one heatmap.
- Multi-timeframe strength monitoring.
- Four strength categories based on RSI and price direction.
- Customizable currency symbols.
- Adjustable RSI period and applied price.
- Configurable bullish and bearish strength thresholds.
- Uses the last closed bar for signal testing.
Best for
- Comparing relative currency strength before selecting a pair.
- Confirming whether a trend has broad currency support.
- Finding strong-versus-weak currency combinations.
- Multi-timeframe momentum analysis.
- Filtering trend-indicator signals before entering a position.
Best Markets
- EURUSD is useful for comparing euro strength against US dollar momentum.
- GBPJPY can offer larger directional moves when both currencies show a pronounced strength difference.
- USDJPY is suitable when dollar and yen strength diverge clearly across H1 and H4.
- AUDUSD can be monitored when Australian dollar momentum strengthens against a weaker US dollar.
- Major Forex pairs generally provide the cleanest application because their currencies are represented across several related pairs.
Trading Styles
- M15 intraday trading using H1 strength as confirmation.
- M5 momentum setups after checking the M15 and H1 heatmap direction.
- H1 trend following when multiple timeframes agree.
- Currency-strength-based pair selection for swing trades on H4.
- London and New York session trading when currency strength begins to separate sharply.
How traders use it
The RSI Heatmap works particularly well as a confirmation tool rather than a standalone entry system.
First identify the strongest and weakest currencies, then select a pair where the two readings create a meaningful contrast.
After that, use a trend indicator such as the Half Trend Indicator for MT5 to determine whether the selected pair is actually moving in the expected direction.
Combining RSI Heatmap with Half Trend for MT5
For a bullish setup, look for the base currency to show improving or strong bullish readings while the quote currency remains weak.
The Half Trend indicator should also point upward.
When both tools agree, the setup has confirmation from both currency strength and price direction.
- Check the RSI Heatmap across M15, H1 and H4.
- Identify a currency showing persistent strength rather than a single strong reading.
- Find a second currency showing weak or declining strength.
- Select a pair where the stronger currency is the base currency.
- Check the Half Trend Indicator on the selected chart.
- For a buy setup, wait for Half Trend to confirm an upward trend.
- Consider entering after price confirms the bullish direction.
- Place the stop below a recent swing low and manage the position according to market structure.
Example: EURUSD Buy Setup
Suppose the RSI Heatmap shows EUR moving from green to light green across M15, H1 and H4, while USD is displaying weaker readings.
EURUSD therefore has a favorable relative-strength relationship.
On the EURUSD chart, the Half Trend Indicator then turns bullish.
A practical entry can be considered after EURUSD pulls back and resumes its upward movement while the Half Trend remains bullish.
The heatmap continues to provide confirmation as long as euro strength persists relative to the dollar.
Bearish Setup
The same principle applies in reverse.
Look for a weakening base currency combined with a stronger quote currency, then confirm that the Half Trend indicator is bearish on the selected pair.
For example, if GBP becomes progressively weaker across several heatmap timeframes while JPY strengthens, GBPJPY may become a candidate for a short setup if Half Trend also points downward.
- GBP shows red or firebrick readings across several timeframes.
- JPY maintains stronger readings.
- GBPJPY is therefore supported by a relative-strength imbalance.
- Half Trend turns bearish on the GBPJPY chart.
- Wait for price to confirm the decline before entering.
- A stop can be positioned above the latest relevant swing high.
This combination helps avoid taking a trend-indicator signal when the underlying currencies are moving against the proposed trade direction.
Get Instant Free Access
Indicator Settings
- Symbols to use – specifies the currency pairs displayed in the heatmap.
- Time frames to use – selects the timeframes used for the strength comparison.
- Rsi period – determines the RSI calculation period.
- Rsi price – selects the price type used for the RSI calculation.
- Strong up level – defines the RSI threshold for strong bullish conditions.
- Weak up level – determines the threshold for weaker bullish conditions.
- Weak down level – defines the level associated with weaker bearish conditions.
- Strong down level – sets the RSI threshold for strong bearish conditions.
- Bar to test – uses the last closed bar for calculating the displayed strength.
Important Notes
- A strong currency reading does not automatically mean that a pair will continue moving in the same direction.
- Comparing several timeframes can help distinguish persistent strength from a short-lived momentum spike.
- Use the Half Trend or another trend indicator to confirm the actual price direction.
- Currency strength can change quickly during major economic releases, particularly during London and New York sessions.
- Pairs with a clear strong-versus-weak relationship are generally more attractive than combinations where both currencies show similar readings.









