
The Traders Dynamic Index indicator for MT5 combines several popular technical concepts into one oscillator.
Its calculation is based on the Relative Strength Index (RSI), smoothing averages and volatility bands, giving traders a compact view of momentum, market direction and changing volatility.
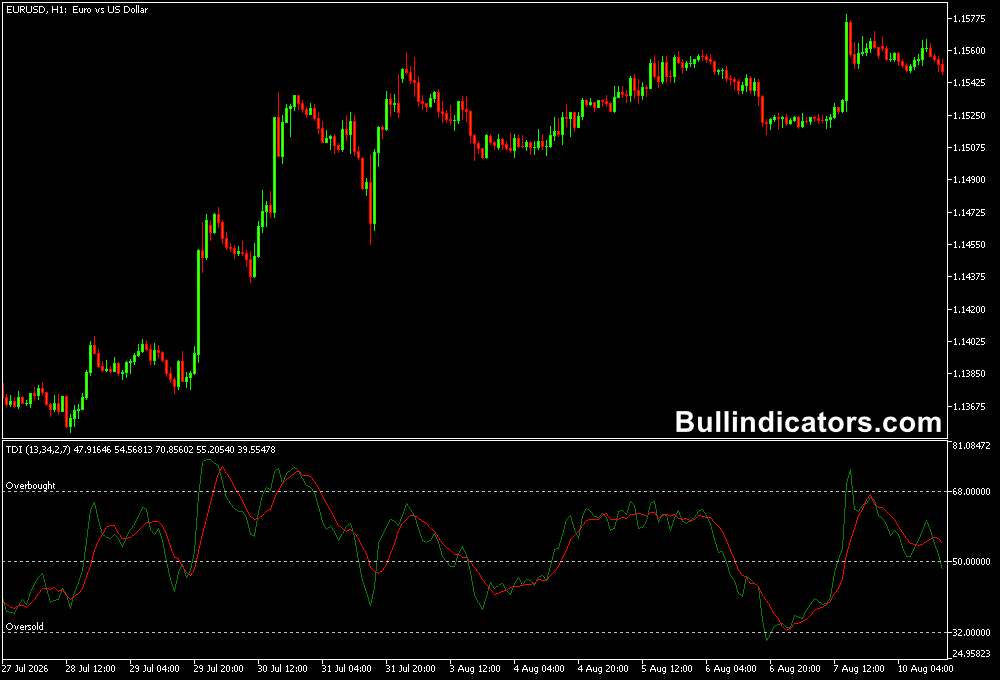
The indicator appears in a separate window beneath the price chart.
Its main components are a green fast line and a red signal line, while optional blue volatility bands and a purple market-base line provide additional context.
Crossovers between the green and red lines can highlight changes in momentum, while the overbought and oversold zones help identify potentially stretched market conditions.
Why traders use the Traders Dynamic Index
The TDI is useful because several forms of market information are brought together in one oscillator.
The RSI component measures momentum, the smoothed lines make changes in momentum easier to follow, and the volatility bands show how widely the indicator is moving around its central value.
A green line crossing above the red line indicates improving bullish momentum, while a downward crossover can signal increasing bearish pressure.
The 68 and 32 levels provide additional reference points for identifying overbought and oversold conditions.
The TDI can be used as a standalone momentum tool, although it becomes more useful when its signals are filtered through the prevailing market trend and price action.
Download This MT5 Indicator for Free
Indicator Chart Setup
The oscillator is displayed below the main price chart.
The green line represents the faster TDI component, while the red line acts as the slower signal line.
The blue volatility bands can be enabled to monitor changes in the oscillator’s range, with the purple center line providing a market-base reference.
The upper zone above 68 represents overbought conditions, while readings below 32 indicate oversold conditions.
Crossovers near these extreme areas can be particularly interesting because they may signal that momentum is starting to turn.
Core Features
- RSI-based momentum calculation.
- Fast green line and slower red signal line.
- Optional volatility bands.
- Central market-base line.
- Overbought and oversold reference levels.
- Adjustable RSI and smoothing parameters.
- Useful for momentum, trend and reversal analysis.
Best for
- Identifying bullish and bearish momentum shifts.
- Trading green and red line crossovers.
- Confirming potential trend reversals.
- Finding pullback entries within established trends.
- Monitoring overbought and oversold conditions.
- Filtering entries with a separate trend indicator.
Best Markets
- Major Forex Pairs: Well suited to EURUSD, GBPUSD, USDJPY, USDCHF, AUDUSD, USDCAD and NZDUSD because of their high liquidity.
- Low-Spread Markets: Particularly useful for short-term TDI crossover strategies where trading costs can have a greater impact on results.
- Liquid Currency Crosses: Can also be applied to active cross pairs when sufficient volume and price movement are present.
- Intraday Forex Markets: Performs well during the London and New York sessions when momentum and directional movement increase.
- Other Liquid Instruments: The TDI can also be applied to indices, commodities and other actively traded markets, provided the price movement is suitable for the selected timeframe.
Trading Styles
- Scalping on M5 and M15 charts using TDI crossovers with trend confirmation.
- Intraday trading on M15 and M30 for momentum and pullback entries.
- Swing trading on H1 and H4 when the TDI agrees with the broader trend.
- Multi-timeframe trading by establishing direction on H1 or H4 and timing entries on M15.
How traders use it
The TDI is most effective when crossover signals are evaluated in the context of the prevailing trend.
A simple way to improve signal quality is to combine the oscillator with the Hull Average 2 Indicator for MT5.
The Hull Average 2 provides the directional filter: a green line indicates bullish conditions, while a red line indicates bearish conditions.
TDI Indicator + Hull Average 2 Strategy
The strategy combines the TDI for momentum confirmation with the Hull Average 2 for trend direction.
The Hull Average 2 acts as the market filter, while the TDI helps identify a suitable entry after momentum turns in the direction of the prevailing trend.
Bullish Setup
- Check that the Hull Average 2 line is green, indicating bullish market conditions.
- Wait for price to make a temporary pullback rather than entering after an extended upward move.
- Monitor the TDI for the green line to cross above the red signal line.
- A stronger setup can develop when the bullish TDI crossover occurs near or below the middle area of the oscillator.
- Consider a buy entry once the bullish crossover is confirmed and the Hull Average 2 remains green.
- Place the stop loss below a recent swing low or another technically relevant support area.
- Consider taking profit near resistance, at a predefined risk-reward level, or when the TDI begins to lose bullish momentum.
Bearish Setup
- Check that the Hull Average 2 line is red, indicating bearish market conditions.
- Allow price to make a temporary upward correction before looking for a short entry.
- Wait for the TDI green line to cross below the red signal line.
- A stronger bearish setup can occur when the crossover develops near or above the middle area of the oscillator.
- Consider a sell entry once the bearish crossover is confirmed and the Hull Average 2 remains red.
- Place the stop loss above a recent swing high or another relevant resistance area.
- Consider taking profit near support, at a predefined risk-reward level, or when the TDI begins to turn bullish.
Additional Confirmation
- A bullish TDI crossover while the Hull Average 2 is red should generally be treated with caution.
- A bearish TDI crossover while the Hull Average 2 is green can also indicate a countertrend move.
- TDI readings below the oversold level can provide additional context for potential bullish reversals.
- TDI readings above the overbought level can help identify areas where bullish momentum may be becoming exhausted.
Get Instant Free Access
Indicator Settings
- RSI period: Sets the calculation period for the RSI component.
- RSI applied price: Determines which price type is used for the RSI calculation.
- Volatility Band period: Controls the calculation period for the volatility bands.
- RSI smoothing period: Sets the smoothing period applied to the RSI line.
- RSI smoothing method: Selects the smoothing method used for the RSI line.
- Signal smoothing period: Determines the smoothing period for the signal line.
- Signal smoothing method: Selects the calculation method used for signal-line smoothing.
- Overbought: Sets the upper overbought reference level.
- Oversold: Sets the lower oversold reference level.
Important Notes
- A TDI crossover should not automatically be treated as a complete trend reversal.
- Strong trends can keep the oscillator near overbought or oversold levels for extended periods.
- Trend confirmation can help filter countertrend crossovers.
- Higher-timeframe direction can provide useful context for lower-timeframe entries.
- The Hull Average 2 can be used as a directional filter when applying the combined strategy.
- Stop-loss placement should account for recent market structure and current volatility.









