
The Schaff Trend Cycle MT5 indicator is a momentum oscillator designed to identify trend cycles earlier than traditional MACD-based analysis.
It combines the principles of MACD and Stochastic calculations to produce a faster oscillator that moves between 0 and 100.
The indicator displays its cycle direction through a colored line, making changes in momentum easier to recognize.
It can be used for identifying potential trend starts, pullbacks, continuation setups, and overbought or oversold conditions across multiple timeframes.
Why traders use the Schaff Trend Cycle Indicator
A major advantage of the Schaff Trend Cycle is its ability to react relatively quickly when momentum changes.
Traditional MACD can be useful for trend analysis but may respond slowly to a developing move.
The Schaff calculation applies additional stochastic processing to the MACD concept, producing a more responsive oscillator.
The 0–100 scale also provides practical reference points.
Readings around 75 and above can indicate strong upside momentum or an overbought condition, while readings around 25 and below can indicate weak momentum or an oversold condition.
For strong trending markets, the indicator is particularly useful when it is treated as a momentum confirmation tool rather than a simple reversal signal.
During an established bullish trend, repeated movements toward the lower part of the oscillator can identify temporary momentum retracements before the next upside phase.
The same principle applies during bearish trends when the oscillator recovers from low levels and subsequently turns downward again.
Download This MT5 Indicator for Free
Indicator Chart Setup
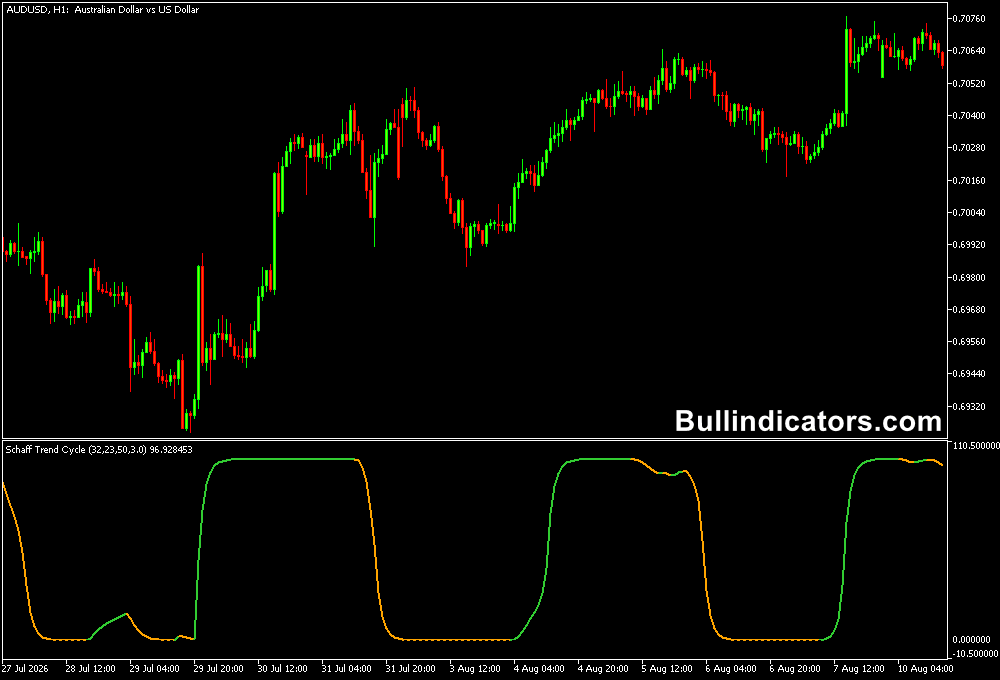
After installation on a MetaTrader 5 chart, the Schaff Trend Cycle appears in a separate indicator window below the price chart.
Its main output is a single colored line that oscillates between 0 and 100.
The line is green during rising phases and orange during falling phases.
Optional levels can be added at 25 and 75.
These levels divide the oscillator into practical zones for assessing momentum and potential exhaustion.
Core Features
- Combines MACD and Stochastic concepts into one oscillator.
- Oscillates between 0 and 100 for straightforward momentum analysis.
- Green line indicates rising oscillator momentum.
- Orange line indicates declining oscillator momentum.
- Optional 25 and 75 levels for oversold and overbought analysis.
- Can be applied to short-term and higher-timeframe charts.
Best for
- Identifying emerging bullish and bearish momentum.
- Confirming continuation entries during established trends.
- Locating momentum pullbacks within strong directional markets.
- Combining oscillator signals with price-action confirmation.
- Multi-timeframe analysis where a higher timeframe defines direction.
Best Markets
- EURUSD and USDJPY are well suited to systematic intraday use because of their liquidity and generally efficient price movement.
- GBPUSD and EURJPY can provide more pronounced oscillator swings during active European and U.S. sessions.
- Gold can be considered on H1 and H4 charts when momentum is clearly directional, although its volatility requires wider risk parameters.
- Major currency pairs with relatively low spreads are preferable for frequent signal-based trading.
Trading Styles
- Scalping: M5 and M15 charts can be used with price-action confirmation after momentum turns.
- Intraday trading: M15 and H1 provide a useful balance between signal frequency and market noise.
- Trend following: H1 and H4 charts are particularly suitable for following established directional moves.
- Swing trading: H4 and D1 can be used to identify broader momentum cycles and continuation phases.
How traders use it
The Schaff Trend Cycle is most effective when its signals are interpreted in the context of the prevailing price trend.
A rising oscillator during a bullish market provides confirmation that upside momentum is returning, while a falling oscillator during a bearish market supports continued downside pressure.
How to trade with it in a strong market trend?
In a strong bullish trend, avoid treating every reading above 75 as an automatic sell signal.
Strong markets can remain overbought for extended periods.
A more practical approach is to wait for a pullback in the oscillator and then look for it to turn upward again while price remains above important support or a trend-following average.
A bullish entry can receive additional confirmation when the candle following the signal closes above the signal candle’s high.
For a strong bearish trend, the opposite approach can be applied.
A move toward or above the upper zone can represent a temporary recovery in momentum rather than a complete trend reversal.
If price remains below resistance or a relevant moving average and the Schaff line turns downward again, the setup can support continuation of the bearish move.
A bearish entry can be confirmed when the following candle closes below the signal candle’s low.
This approach makes the indicator useful in trending conditions because the oscillator becomes a timing mechanism for joining an existing directional move rather than repeatedly attempting to predict tops and bottoms.
Get Instant Free Access
Indicator Settings
- SchaffPeriod: Defines the main calculation period used by the Schaff Trend Cycle.
- FastMA: Controls the fast moving average used in the MACD calculation.
- SlowMA: Controls the slower moving average used to determine the underlying MACD trend component.
- Smoothing Period: Determines how much the resulting oscillator line is smoothed.
Important Notes
- Overbought and oversold readings should not automatically be treated as reversal signals, particularly during powerful trends.
- Strong bullish markets can keep the oscillator near the upper zone for prolonged periods.
- Strong bearish markets can remain near the lower zone while price continues moving downward.
- Use price action, support and resistance, or a separate trend filter to validate entries.
- Higher timeframes can help distinguish genuine trend cycles from short-term market noise.
- Risk management remains essential because no oscillator can eliminate false signals.









