
The Super Signals Channel V3 indicator for MT5 combines directional signal dots with a price channel that helps identify the prevailing market trend.
Green dots indicate bullish momentum, while red dots point to bearish conditions.
The channel itself provides another way to assess direction, with its rising or declining slope helping determine whether buyers or sellers are controlling the market.
The channel boundaries also provide useful reference points for support and resistance.
The dark green line represents support, while the pink line acts as resistance.
This allows the indicator to be used not only for identifying potential entries, but also for locating areas where price may react during an established trend.
Why traders use the Super Signals Channel V3 Indicator
The combination of signal dots and channel direction gives the chart two separate pieces of information.
The dots highlight potential changes in momentum, while the channel helps determine whether those signals agree with the broader price movement.
This distinction is particularly important on lower timeframes.
M1 and M5 charts can produce frequent market fluctuations, so a single green or red dot should not automatically trigger a position.
Waiting for the channel to confirm the same direction can help filter weaker signals and improve trade selection.
Download This MT5 Indicator for Free
Indicator Chart Setup
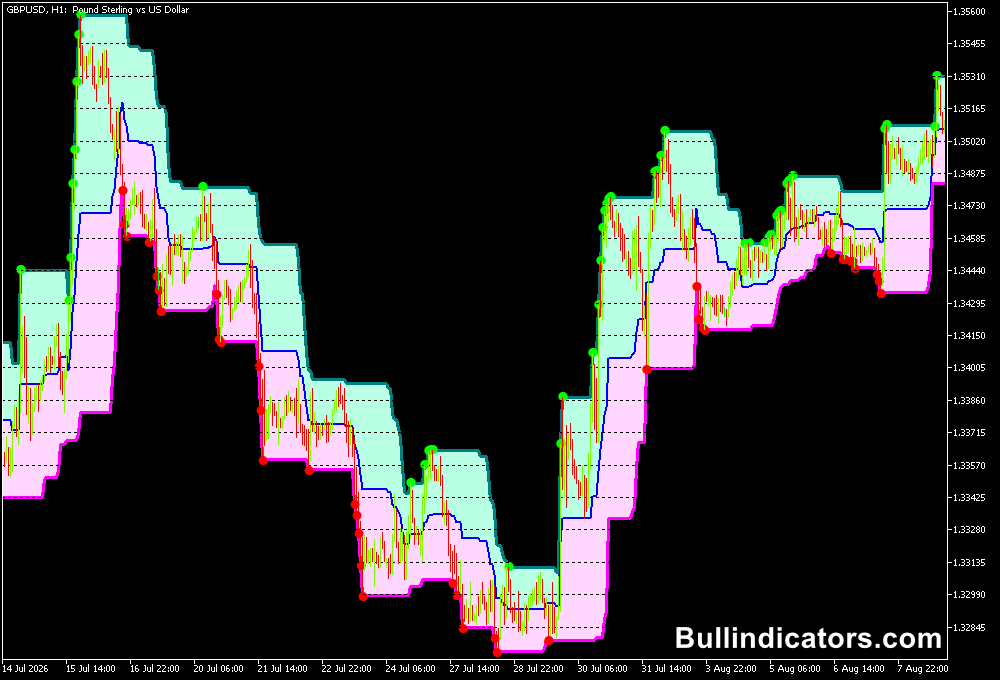
The indicator plots green and red dots around price as market momentum changes.
A green dot represents a potential bullish signal, while a red dot indicates bearish momentum.
Two channel boundaries accompany the signals.
The dark green boundary functions as dynamic support and the pink boundary represents resistance.
A rising channel suggests an upward market bias, while a declining channel points toward a bearish environment.
When the channel is relatively flat, signal quality can deteriorate because the market lacks a strong directional tendency.
Core Features
- Green dots for potential bullish signals.
- Red dots for potential bearish signals.
- Directional channel for trend identification.
- Dark green channel line as a support reference.
- Pink channel line as a resistance reference.
- Adjustable signal gap.
- Optional future bounce setting.
- Redraw function for updating signals as new data arrives.
- Customizable colors and line width.
Best for
- Identifying the prevailing intraday direction.
- Following established channel trends.
- Using channel boundaries as dynamic support and resistance.
- Filtering short-term entries with higher-timeframe confirmation.
- London-session momentum trading on liquid currency pairs.
Best Markets
- EURUSD is particularly suitable for London-session analysis because of its liquidity and frequent directional moves.
- GBPUSD can produce stronger M1 and M5 momentum, although its larger intraday swings require disciplined risk management.
- USDJPY can also be monitored when London trading produces a clear directional shift.
- Major Forex pairs are generally preferable to less liquid crosses when using the indicator for short-term entries.
Trading Styles
- M1 scalping using M5 channel direction as the primary filter.
- M5 London-session momentum trading.
- Pullback entries toward the channel support or resistance boundary.
- Short-term breakout trading when price leaves a well-defined channel with strong momentum.
- Intraday trend following when the channel maintains a consistent slope.
How traders use it
A practical method is to separate trend identification from entry timing.
Use the M5 chart to establish the directional bias, then move to M1 only when a more precise entry is required. A green M5 channel favors long positions, while a declining channel supports bearish setups.
EURUSD London Session M1/M5 Buy Example
Suppose the London session begins with EURUSD breaking upward from its early-session range.
On M5, the Super Signals Channel is rising and the dark green support line is moving higher.
This establishes a bullish environment. Rather than buying the first M5 green dot, wait for a pullback and use M1 to refine the entry.
- M5 channel is clearly rising.
- EURUSD remains above the dark green channel support.
- A temporary M1 pullback develops toward a short-term support area.
- The M1 chart produces a green dot as bullish momentum returns.
- Price begins moving upward again while the M5 channel remains bullish.
- Consider the buy entry after the M1 confirmation.
- Place the stop below the recent M1 swing low or below a suitable support area.
- The M5 resistance line can provide an initial profit-management reference.
The key is that the M1 signal is being used for timing, while the M5 channel supplies the directional filter.
This reduces the temptation to trade every green and red dot that appears during the London session.
GBPUSD London Session M1/M5 Sell Example
Now consider GBPUSD during the same session. Assume the M5 channel has turned downward, with the pink resistance boundary above price and successive lower highs developing.
This establishes a bearish bias. After a temporary M1 rally, wait for selling pressure to return.
- The M5 channel is declining.
- GBPUSD remains below the pink resistance boundary.
- Price makes an M1 retracement toward short-term resistance.
- A red M1 dot appears as downward momentum resumes.
- The M5 channel continues pointing lower.
- Consider a short entry after the bearish signal receives confirmation from price.
- Place the stop above the recent M1 swing high.
- The lower channel area can be monitored as a potential support and profit-management zone.
If the M5 channel is flat and M1 signals are switching repeatedly between green and red, it is generally better to wait.
The indicator becomes more useful when the channel and signal dots point in the same direction.
Get Instant Free Access
Indicator Settings
- SignalGap – controls the distance or gap associated with the signal dots.
- Bounce into the future – determines the amount of future bounce used by the indicator.
- Redraw – allows the indicator to update or redraw previous signals when new market data is received.
- Colors – controls the visual colors used for the indicator components.
- Line Width – adjusts the thickness of the channel lines.
Important Notes
- M1 signals can be frequent and should be filtered using the broader M5 direction.
- A rising channel favors bullish setups, while a declining channel favors bearish trades.
- Flat channels can produce lower-quality signals because directional momentum is limited.
- Allowing the trend to develop can help reduce reactions to temporary signal changes.
- The redraw function should be understood before using historical signals for strategy evaluation.
- GBPUSD can move quickly during the London session, so stops should account for current volatility rather than using a fixed distance.









