
The Valid Swing High Low indicator for MT5 is a price-action tool designed to identify recent swing highs, swing lows and changes in market direction.
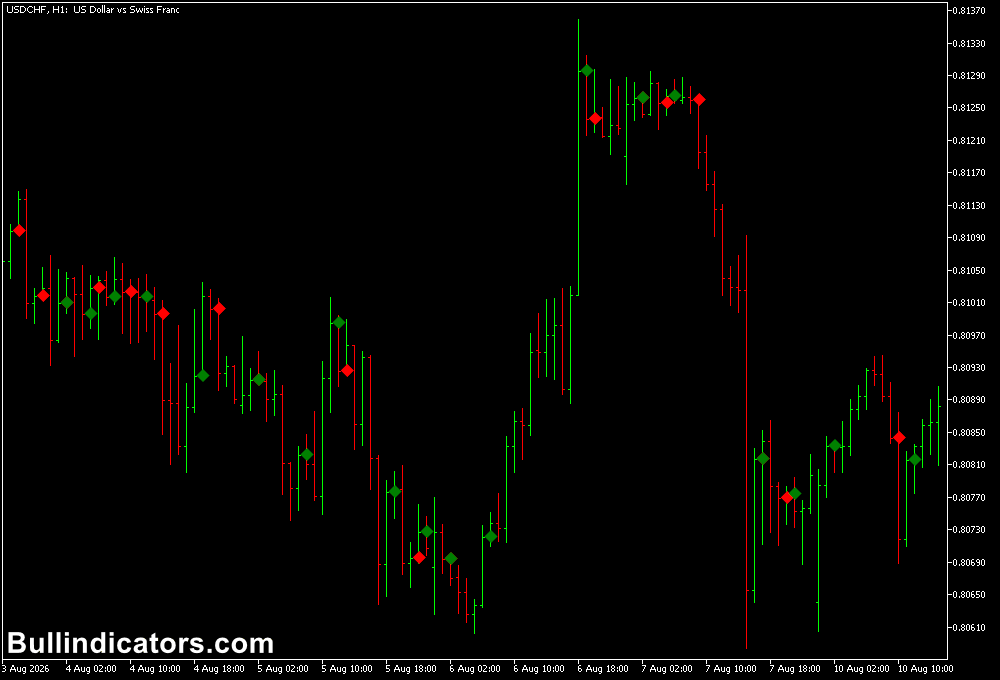
It marks major and minor swing points on the chart and uses colored dots to highlight potential bullish and bearish reversals.
A moving average is also included as a reference for evaluating whether a swing has developed in the direction of the prevailing trend.
This makes the indicator useful for locating market structure, planning entries around swing points and setting logical stop-loss and profit targets.
Why traders use the Valid Swing High Low Indicator
Swing highs and lows are fundamental reference points for reading price structure.
They can show where buying or selling pressure has previously changed and provide practical locations for entries, stops and targets.
The Valid Swing High Low indicator simplifies this process by displaying recent swings directly on the MT5 chart.
Green dots identify potential bullish reversals, while red dots indicate potential bearish reversals.
The major and minor swing markings provide additional context about the significance of each price movement.
The indicator can also be combined with an oscillator to improve reversal timing.
For example, the Schaff Trend Cycle Indicator can be used to identify overbought and oversold conditions.
A bearish swing signal near an overbought reading can strengthen a short setup, while a bullish swing signal appearing when the oscillator is oversold can provide additional support for a long setup.
Download This MT5 Indicator for Free
Indicator Chart Setup
The indicator is displayed directly on the MT5 price chart. It identifies major and minor swing highs and lows using different visual markings and includes a moving average that acts as a trend reference.
Green dots indicate potential bullish reversals, while red dots indicate potential bearish reversals.
The swing points can be used to determine where a trend may be changing and where price could encounter its next structural level.
Core Features
- Identifies recent swing highs and swing lows.
- Displays major and minor swing points.
- Marks potential bullish reversals with green dots.
- Marks potential bearish reversals with red dots.
- Includes a moving average for trend confirmation.
- Provides swing-based reference points for stop loss and take profit placement.
- Can be combined with oscillators for additional reversal confirmation.
Best for
- Reading recent market structure.
- Identifying potential trend reversals.
- Trading from swing highs and swing lows.
- Locating logical stop-loss positions.
- Combining price structure with momentum and overbought/oversold analysis.
Best Markets
- EURUSD and GBPUSD offer frequent swing formations suitable for intraday analysis.
- USDJPY can be useful for H1 and H4 swing trading when directional price structure is established.
- EURJPY and GBPJPY can provide larger swing distances for traders comfortable with higher volatility.
- Gold can be monitored on H1 and H4 for larger reversal and continuation structures.
Trading Styles
- Intraday trading: M15 and H1 charts can be used to identify short-term swing reversals.
- Trend following: H1 and H4 provide a broader view of major swing structure.
- Swing trading: H4 charts can be used to target larger movements between significant swing points.
- Reversal trading: M15 and H1 setups can combine swing dots with an oscillator’s overbought or oversold readings.
How traders use it
The indicator works well when the swing signal, price structure and broader trend point in the same direction.
The moving average can help determine whether a reversal signal is developing against or with the prevailing trend.
Bullish Setup
- Look for a green dot near a recent swing low.
- Check whether price is showing signs of bullish momentum or recovering above the moving average.
- For stronger reversal confirmation, look for the Schaff Trend Cycle to be in or recovering from its oversold zone.
- Enter on the signal candle or wait for the following candle for more confirmation.
- Place the stop loss below the recent swing low.
- Use the next significant swing high as a potential profit target.
Bearish Setup
- Look for a red dot near a recent swing high.
- Check whether price is rejecting resistance or moving below the moving average.
- A Schaff Trend Cycle reading in or emerging from the overbought zone can strengthen the reversal setup.
- Enter on the signal candle or wait for the next candle to confirm the bearish move.
- Place the stop loss above the recent swing high.
- Use the next significant swing low as a potential target.
For example, on EURUSD M15, a red swing dot forming near resistance becomes more interesting when the Schaff Trend Cycle is above 75, indicating elevated momentum.
If the oscillator turns down and price breaks the signal candle’s low, the combination provides a more selective short setup.
For a bullish trade, the reverse conditions can be applied around support with the oscillator near or below 25.
Get Instant Free Access
Indicator Settings
- Bar of drawing: Selects the signal bar used for identifying and drawing the fractal-based swing signal.
Important Notes
- Swing signals should be interpreted in relation to the broader price structure rather than traded automatically.
- Major and minor swings can have different significance depending on the timeframe being analyzed.
- The moving average provides a trend reference but does not eliminate false reversal signals.
- Overbought and oversold readings can persist during strong trends, so the Schaff Trend Cycle should be combined with price structure rather than used alone.
- The 75 and 25 levels on the Schaff Trend Cycle can provide useful reference zones for bearish and bullish reversal setups respectively.
- Stop-loss placement should account for normal market volatility and the distance to the relevant swing point.









