
The Volume Weighted MA Indicator for MT5 combines price movement with volume information to create a moving average that gives greater importance to higher-volume candles.
The result behaves much like a conventional moving average, but its calculation gives more influence to periods where trading activity is stronger.
VWMA can be used to establish the prevailing trend, identify dynamic support and resistance, and locate potential continuation or breakout entries.
The line can also change color as market direction develops, providing an additional way to monitor shifts in momentum.
Unlike a standard moving average that treats each candle according to its price data, VWMA incorporates volume into its calculation.
This makes it particularly interesting when increased market participation accompanies a directional move.
Why traders use the Volume Weighted MA Indicator
VWMA provides a practical way to combine trend direction with market activity.
When price remains above the VWMA, the market has a bullish bias. Sustained trading below the line indicates bearish pressure.
This simple relationship makes the indicator suitable as a directional filter before entering a position.
The VWMA can also act as a moving support or resistance level.
During an established uptrend, price may pull back toward the line before buyers regain control.
In a downtrend, rallies toward the VWMA can encounter selling pressure.
Another useful application is breakout analysis.
A decisive move through the VWMA accompanied by increased activity can signal that the balance between buyers and sellers is changing.
The indicator can therefore be used as part of trend-following, pullback and breakout strategies.
Download This MT5 Indicator for Free
Indicator Chart Setup
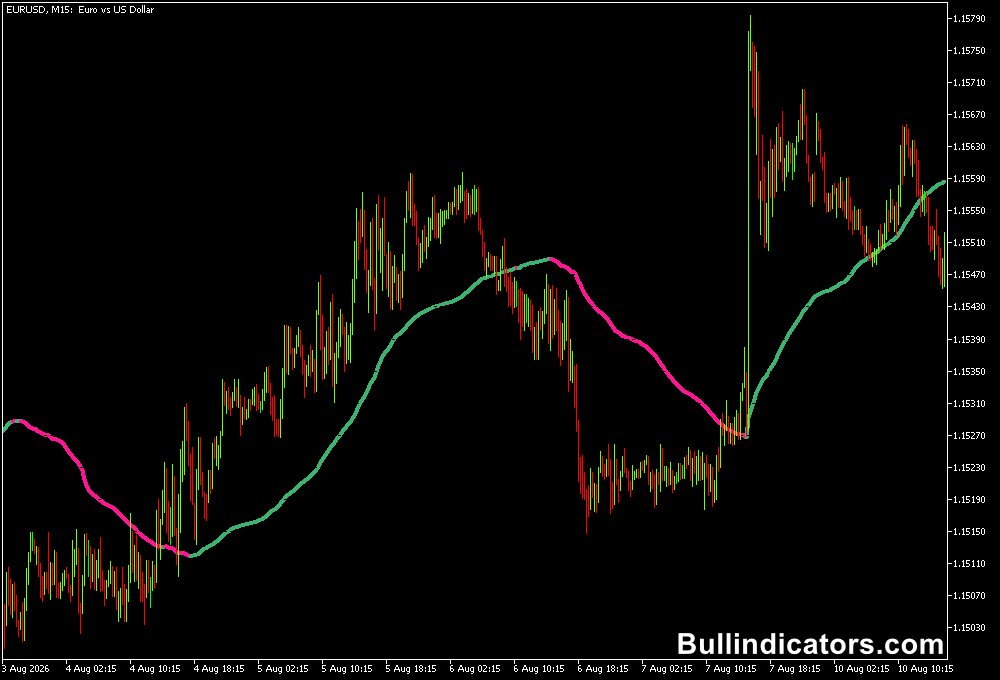
The Volume Weighted MA appears directly on the MT5 price chart as a moving average line.
It follows price movement while giving greater influence to candles with stronger volume.
Depending on the current market direction, the line can also change color to help identify a developing trend shift.
Price above the VWMA indicates bullish conditions, while price below the line points to bearish conditions.
The slope of the line provides another useful reference.
A rising VWMA supports a stronger bullish environment, whereas a declining line indicates that bearish pressure is developing or remaining dominant.
Core Features
- Combines moving-average analysis with volume information.
- Gives greater weighting to higher-volume candles.
- Identifies bullish and bearish market conditions through price position.
- Can function as dynamic support during upward trends.
- Can act as dynamic resistance during downward trends.
- Useful for pullback, breakout and trend-continuation setups.
- Supports real volume or tick volume according to the selected setting.
- Can be applied to Forex, indices, stocks, commodities, metals and cryptocurrencies.
Best for
- Establishing the directional bias before looking for an entry.
- Finding pullbacks toward a volume-weighted dynamic level.
- Confirming whether a breakout has moved decisively through the average.
- Managing an open trend while price respects the VWMA.
- Combining volume-based analysis with conventional moving averages.
Best Markets
- EURUSD: Well suited to intraday VWMA pullbacks during periods of strong European and US liquidity.
- GBPJPY: Useful for fast trend movements where price repeatedly tests dynamic levels.
- USDCHF: Can be used for cleaner directional setups on M15 and H1 charts.
- Gold (XAUUSD): Useful for identifying whether strong price movements are holding above or below the weighted average.
- US indices: NASDAQ and US30 can provide interesting VWMA breakout setups around major market openings.
- Bitcoin: The indicator can help track aggressive directional moves where volume expands significantly.
Trading Styles
- Pullback trading: M5 and M15 charts can be used to enter in the direction of the prevailing VWMA trend after price retraces to the line.
- Intraday trend following: H1 setups can use the VWMA as both a directional filter and trade-management reference.
- Breakout trading: M15 or H1 traders can monitor decisive price movement through the VWMA after consolidation.
- Scalping: M1 and M5 charts can use VWMA direction to filter short-term entries, particularly on highly liquid EURUSD or GBPUSD.
- Position trading: H4 and D1 charts can use the VWMA to identify longer-lasting directional conditions.
How traders use it
A straightforward bullish strategy begins with price holding above a rising VWMA.
Rather than buying an extended move, wait for a controlled pullback toward the line.
If price finds support and resumes upward movement, the VWMA has acted as a dynamic buying area.
A stop-loss can be positioned below the pullback low, while the next resistance zone provides a potential target.
For a bearish setup, price should be below a declining VWMA. A rally back toward the average can then be monitored for rejection.
If sellers regain control and price moves away from the VWMA, a short position can be considered.
The recent swing high provides a logical reference for the stop-loss.
The VWMA can also be used for breakout trading.
When price has remained compressed around one level and then makes a decisive move through the VWMA, increased volume can add significance to the breakout.
A retest of the VWMA after the break can provide a more controlled entry than chasing the initial candle.
For additional confirmation, the VWMA can be combined with another moving average.
For example, a faster conventional MA crossing above a slower VWMA can support a bullish trend setup, while the opposite crossover can indicate weakening conditions.
Get Instant Free Access
Indicator Settings
- Price: Defines the calculation period of the VWMA. For example, a 4-period setting calculates the volume-weighted average using the relevant price and volume information from the previous four candles.
- Volume to use: Determines which volume source is used by the calculation. You can select real volume or tick volume, depending on the available data from your broker and instrument.
Important Notes
- The VWMA is a trend and price-level tool, not a guarantee of future price direction.
- Price repeatedly crossing the line can indicate a range-bound market and produce less reliable trend signals.
- Shorter periods react faster to price and volume changes but can produce more frequent signals.
- Real volume availability varies between markets and brokers, while Forex platforms commonly provide tick volume.
- A VWMA break is more meaningful when supported by a decisive price candle and increased market activity.
- Test the selected period on each instrument and timeframe because volatility and volume characteristics differ substantially between markets.









