
The Stochastic Divergence indicator for MT5 automatically detects discrepancies between price action and the Stochastic oscillator.
These divergences can reveal situations where momentum is no longer confirming the current price movement, potentially warning of a reversal or signaling that an existing trend may continue.
The indicator identifies both classic and hidden divergences.
Classic divergence is generally associated with potential trend reversals, while hidden divergence can support trend-continuation setups.
Signals are displayed directly on the chart with colored arrows, making it easier to identify potential opportunities without manually comparing each price swing to the Stochastic oscillator.
It can be used across different markets and timeframes, while optional notifications make it practical for monitoring several charts at once.
Why traders use the Stochastic Divergence Indicator
Manually searching for divergence requires comparing successive highs and lows on the price chart with corresponding movements in the oscillator.
This can be time-consuming, particularly when monitoring several currency pairs.
The Stochastic Divergence Indicator automates this process and highlights detected discrepancies on the chart.
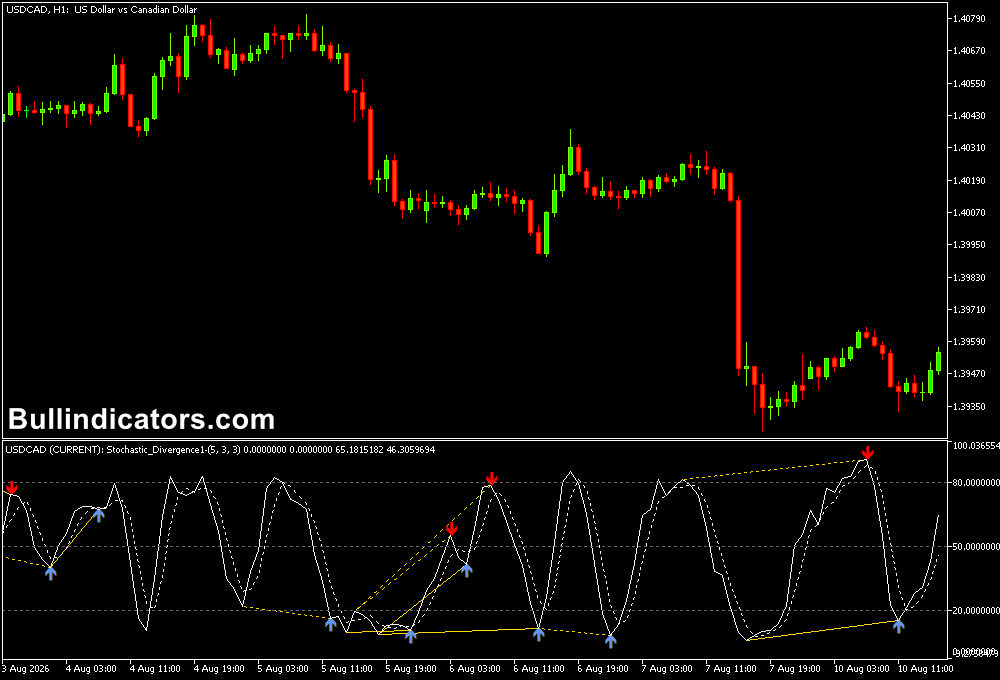
Blue arrows indicate potential buying opportunities, while red arrows highlight potential selling conditions.
These signals become more useful when considered within the broader market trend.
For example, bullish divergence has greater relevance near support during a bullish market, while bearish divergence can be more valuable around resistance in a bearish environment.
The indicator can also help with trade management.
An opposing divergence signal may provide a reason to reduce exposure or reassess an existing position, particularly when price is approaching an important technical level.
Download This MT5 Indicator for Free
Indicator Chart Setup
The indicator analyzes price swings together with the Stochastic oscillator and marks detected divergence directly on the MT5 chart.
Blue arrows identify potential bullish conditions and red arrows identify potential bearish conditions.
Classic bullish divergence occurs when price forms a lower low while the oscillator forms a higher low.
Classic bearish divergence occurs when price creates a higher high while the oscillator forms a lower high.
Hidden divergence has the opposite purpose and can indicate that the existing trend may resume after a correction.
The indicator can also generate notifications through the Alerts window and can be configured to send signals by email, depending on the selected platform settings.
Core Features
- Automatically identifies divergences between price and the Stochastic oscillator.
- Detects classic divergence associated with potential reversals.
- Detects hidden divergence that can support trend-continuation setups.
- Blue arrows highlight potential bullish signals.
- Red arrows highlight potential bearish signals.
- Supports multiple timeframe analysis.
- Optional chart arrows make historical signals easy to review.
- Supports alerts and email notifications.
- Does not repaint according to the supplied indicator description.
Best for
- Finding momentum discrepancies around important support and resistance levels.
- Confirming potential reversals after extended price movements.
- Identifying pullback opportunities within established trends through hidden divergence.
- Scanning historical divergence signals to evaluate a trading setup.
- Monitoring several markets without manually comparing every oscillator swing.
Best Markets
- EURUSD: Suitable for structured divergence setups on M15 and H1 charts.
- GBPJPY: Useful when larger intraday swings create pronounced highs and lows.
- USDJPY: Well suited to H1 and H4 divergence analysis around major technical levels.
- Gold (XAUUSD): Can be useful for spotting momentum deterioration after extended directional moves.
- NAS100: Interesting for reversal and continuation analysis around major intraday support and resistance.
Trading Styles
- Reversal trading: M15 and H1 charts can be used to find classic divergence near established support or resistance.
- Trend continuation: M5 and M15 hidden divergence can identify potential entries after a temporary pullback.
- Intraday swing trading: H1 setups can capture larger directional reversals without the noise of very short timeframes.
- Scalping: M1 and M5 divergence can be used selectively on liquid pairs, preferably with an additional trend filter.
- Multi-timeframe analysis: Use H1 to determine the broader direction and M5 to search for a lower-timeframe divergence entry.
How traders use it
A bullish setup starts when price makes a lower low while the Stochastic oscillator produces a higher low.
This classic bullish divergence suggests that downward momentum is weakening.
A blue arrow provides the visual signal, but the setup becomes more compelling when it appears close to established support or after a failed bearish breakout.
For bearish divergence, price forms a higher high while the Stochastic oscillator creates a lower high.
A red arrow highlights the potential selling condition.
Resistance, a failed breakout or bearish price confirmation can then be used to determine whether the signal offers a suitable entry.
Hidden divergence has a different application.
For example, during an established bullish trend, price may form a higher low while the oscillator makes a lower low.
This bullish hidden divergence can indicate that the correction is losing momentum and that the underlying uptrend may resume.
For risk management, a bullish position can use the previous swing low as a stop reference, while a bearish position can use the previous swing high.
Profit can be taken near the next major technical level or managed until an opposing signal appears.
Combining Stochastic Divergence with the Kolier SuperTrend Indicator
The Stochastic Divergence Indicator can be combined with the Kolier SuperTrend Indicator for MT5 to add a trend-direction filter to divergence signals.
The Kolier SuperTrend helps establish whether the market is currently favoring bullish or bearish conditions, while Stochastic Divergence identifies a potential momentum shift or continuation point.
- BUY setup: Wait for the Kolier SuperTrend to show a bullish condition and then look for a blue Stochastic Divergence signal.
- SELL setup: Look for a bearish Kolier SuperTrend condition followed by a red Stochastic Divergence signal.
- Trend filter: Give greater priority to blue divergence signals when the broader SuperTrend direction is bullish and red signals when it is bearish.
- Entry confirmation: After the divergence arrow appears, wait for price to confirm the direction through a break of a nearby swing level.
- Risk control: Place the stop below the recent swing low for BUY trades or above the recent swing high for SELL trades.
This combination can be particularly useful on M5 and M15 charts because the SuperTrend establishes the directional bias while divergence helps locate a more precise entry following a pullback.
Get Instant Free Access
Indicator Settings
- KPeriod: Defines the period of the %K line, which is the main Stochastic oscillator line.
- DPeriod: Sets the period used to calculate the %D line, which is the moving average of %K.
- Slowing: Controls the smoothing applied to the Stochastic calculation. Increasing the value reduces sensitivity and can help filter short-term market noise.
Important Notes
- A divergence signal indicates a potential change in momentum, not a guaranteed reversal.
- Classic divergence is generally more useful when supported by a significant support or resistance area.
- Prioritize signals that agree with the broader market direction when trading continuation setups.
- Low timeframes can produce more frequent signals and require stronger price confirmation.
- Blue signals suggest looking for buying opportunities, while red signals highlight potential selling conditions.
- Test the indicator settings on the selected instrument and timeframe before applying the strategy to live trades.









