
The TDI Indicator for MT5, based on the Traders Dynamic Index developed by Dean Malone, combines several popular technical concepts into one trading tool.
It uses RSI calculations together with moving averages and Bollinger Band principles to help assess market momentum, direction and volatility.
The indicator is displayed in a separate window below the price chart. Its colored lines make it possible to monitor changes in momentum and identify potential entry and exit points through crossovers.
A histogram provides an additional indication of the prevailing trading direction.
Why traders use the TDI Indicator for MT5
The main attraction of the TDI is that several forms of market analysis are brought together in a single indicator.
The green fast line reacts more quickly to price movement, while the red signal line uses a longer calculation period and provides a slower reference.
Crossovers between these lines can highlight momentum shifts.
The histogram adds another layer of confirmation by showing whether bullish or bearish pressure is currently dominant.
This makes the TDI useful for both trend-following and shorter-term momentum strategies.
Download This MT5 Indicator for Free
Indicator Chart Setup
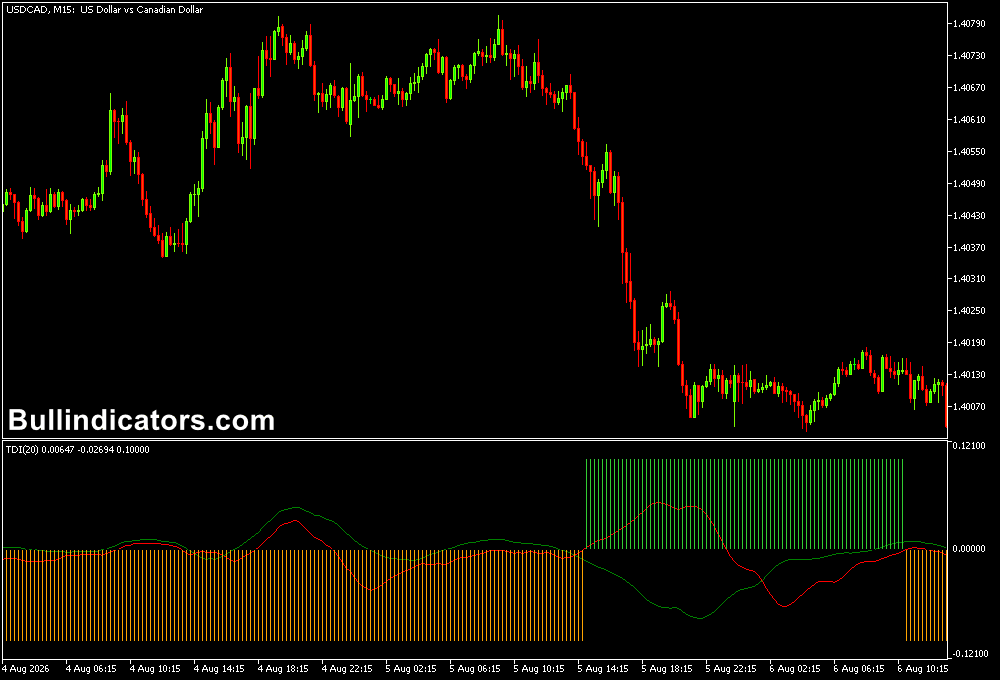
After attaching the TDI to an MT5 chart, the indicator appears in a separate window underneath price.
The display contains the green fast line and red signal line, with additional histogram information showing the preferred market direction.
The interaction between these components helps identify changes in momentum without placing extra objects directly over the candlesticks.
Core Features
- Combines RSI, moving average and volatility-based calculations.
- Green fast line responds to shorter-term market momentum.
- Red signal line provides a slower reference for crossovers.
- Histogram indicates the dominant directional bias.
- Works across multiple forex pairs and MT5 timeframes.
- Useful for identifying momentum shifts and potential reversals.
Best for
- Spotting bullish and bearish momentum crossovers.
- Confirming the direction of an existing market move.
- Finding continuation entries after temporary retracements.
- Filtering weaker signals with histogram direction.
- Timing entries around changes in short-term momentum.
Best Markets
- EURUSD: Well suited to intraday momentum setups on M15 and H1.
- GBPUSD: Useful for active London-session crossover signals.
- USDJPY: Suitable for trend-following setups on M15 and H1.
- GBPJPY: Can be applied to faster M5 strategies when volatility increases.
- XAUUSD: Useful for monitoring momentum changes on M15 and H1, with price-action confirmation recommended.
Trading Styles
- Scalping: M5 charts can be used for quick crossover setups on liquid pairs.
- Intraday trading: M15 and H1 provide a practical balance between signal frequency and market noise.
- Swing trading: H4 charts can help identify broader momentum changes.
- Trend trading: The histogram direction can help maintain positions while momentum remains supportive.
How traders use it
A common approach is to wait for the green line to cross the red line. When the green line moves above the red line, it can indicate improving bullish momentum and a potential buy setup.
A downward crossover can indicate weakening momentum and a possible sell opportunity.
The histogram can be used as confirmation.
A change toward green supports bullish conditions, while an orange reading suggests bearish pressure.
For stronger setups, the crossover can be combined with support and resistance, candlestick formations or the broader trend visible on the price chart.
For a long position, a logical exit can be placed around the next resistance zone or when momentum turns bearish.
Short positions can be managed toward the next support area or closed when the TDI shows a bullish crossover.
Stop-loss placement should be based on recent swing highs, swing lows or the volatility of the market being traded.
Get Instant Free Access
Indicator Settings
- Period: Controls the calculation period and influences how responsive the indicator is to price movement.
- Colors: Adjusts the appearance of the indicator lines and histogram.
- Style: Controls the visual presentation of the indicator components.
Important Notes
- A crossover is a momentum signal and should not automatically be treated as a guaranteed entry.
- Signals on very low timeframes can occur frequently during sideways markets.
- Use nearby support and resistance to determine practical entry and exit locations.
- Higher-timeframe direction can help filter weaker lower-timeframe signals.
- The TDI can be combined with price action or another independent confirmation method for more selective setups.









