
The Bollinger Bands Color indicator for MT5 is a volatility-based trading tool that combines traditional Bollinger Bands with color-coded market signals.
It automatically changes the color of the upper and lower bands based on market direction, making it easier to recognize bullish and bearish conditions without manually interpreting every price movement.
The indicator consists of a central moving average with upper and lower volatility bands that expand during active markets and contract during quiet periods.
This provides valuable information for identifying trends, breakouts, ranging markets, and potential reversal zones.
It is suitable for all MetaTrader 5 timeframes and can be used on forex pairs, commodities, indices, stocks, and cryptocurrencies.
Why Traders Use the Bollinger Bands Color Indicator
Volatility is one of the most important factors when planning a trade.
The Bollinger Bands Color Indicator allows traders to quickly determine whether the market is gaining momentum or entering a period of consolidation.
The changing band colors provide additional confirmation by highlighting bullish and bearish market sentiment.
Another advantage is its versatility.
The indicator can be used for breakout trading, trend-following strategies, range trading, or identifying potential exhaustion after strong price moves.
Because the calculations are performed automatically, it provides a clean visual representation of changing market conditions.
Download This MT5 Indicator for Free
Indicator Chart Setup
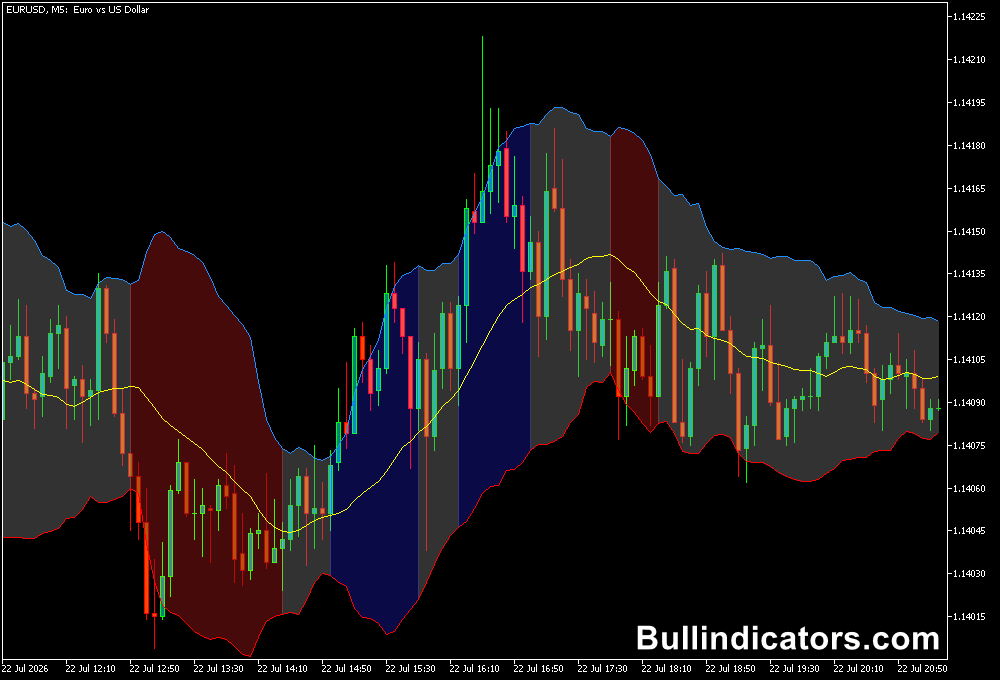
After applying the indicator to a MetaTrader 5 chart, three lines become visible.
The light blue center line represents the moving average, while the upper and lower Bollinger Bands automatically change color according to market direction.
Blue bands indicate bullish conditions, while red bands indicate bearish pressure.
As volatility increases, the distance between the bands widens.
During periods of lower volatility, the bands contract, often signaling that a stronger price movement may be approaching.
The color changes combined with band expansion provide an easy way to monitor changing market conditions.
Core Features
- Color-coded Bollinger Bands for bullish and bearish conditions.
- Automatically measures market volatility.
- Highlights trend continuation and breakout opportunities.
- Displays dynamic upper and lower volatility bands.
- Works on every MetaTrader 5 timeframe.
- Suitable for all financial markets.
Best for
- Trend-following strategies.
- Volatility analysis.
- Breakout trading.
- Range market identification.
- Momentum confirmation.
- Trade entry and exit timing.
Best Markets
- EUR/USD, GBP/USD, USD/CAD, and AUD/USD.
- Gold (XAU/USD) and Silver (XAG/USD).
- NASDAQ 100 and US30 indices.
- Bitcoin and Ethereum.
- Major stock CFDs.
- Crude Oil markets.
Trading Styles
- Scalping on M5 during volatility expansion.
- Intraday trading on M15 and M30.
- Swing trading on H1 and H4.
- Trend trading on Daily charts.
- Breakout strategies during major market sessions.
- Volatility-based trading across multiple timeframes.
How Traders Use It
A common approach is to wait for price to close above the center moving average while both outer bands turn blue.
This combination suggests strengthening bullish momentum and may provide a buying opportunity.
For bearish setups, traders typically wait for price to close below the moving average while both bands change to red before considering short positions.
The indicator also helps identify changing volatility conditions.
Narrow bands often appear before larger market moves, while rapidly expanding bands usually confirm increasing momentum.
For additional confirmation, many traders combine the indicator with support and resistance levels, candlestick analysis, or momentum oscillators.
Get Instant Free Access
Indicator Settings
- Period: Sets the calculation period for measuring volatility.
- Bollinger Bands Width: Adjusts the distance between the upper and lower bands.
- Colors: Customize the appearance of the indicator lines.
- Style: Select the preferred line style.
Important Notes
- Blue bands indicate bullish market sentiment, while red bands indicate bearish conditions.
- Band expansion signals increasing volatility and stronger price movement.
- Narrow bands often precede breakout opportunities.
- Use price action or additional indicators to confirm trade entries.
- Suitable for every MetaTrader 5 timeframe.
- Works across forex, commodities, indices, stocks, and cryptocurrencies.









