
The Pivot Points All In One indicator for MT5 brings several established pivot-point calculation methods together in a single chart tool.
Pivot points are widely used to identify potential support, resistance, continuation and reversal areas, making them useful for planning entries, stop-loss levels and profit targets.
Rather than working with one calculation method, this indicator provides Classic, Woody, Fibonacci, Camarilla and Central Pivot Range (CPR) approaches.
Each method calculates its levels differently, so the resulting support and resistance zones can vary.
Having the different methods available makes it possible to select the approach that fits a particular market, timeframe or trading strategy.
The indicator automatically plots the selected levels on the MT5 chart.
This removes the need to calculate and draw the pivot levels manually, while allowing the analysis to remain focused on how price behaves around important reference points.
Why traders use the Pivot Points All In One Indicator
Pivot levels are particularly useful because they give price a set of predefined reference areas for the trading session or period being analyzed.
When price approaches a pivot, support or resistance level, the reaction can provide information about whether the market is likely to reject the area, consolidate around it or break through.
Classic pivots are widely used for conventional support and resistance analysis, Fibonacci pivots can be useful when looking for trend resumption after a correction, while Camarilla levels are often suited to active intraday trading.
Woody pivots give greater importance to the previous closing price, and CPR provides a compact view of the central trading range.
This makes the indicator suitable for several different trading approaches without requiring a separate pivot indicator for each calculation method.
Download This MT5 Indicator for Free
Indicator Chart Setup
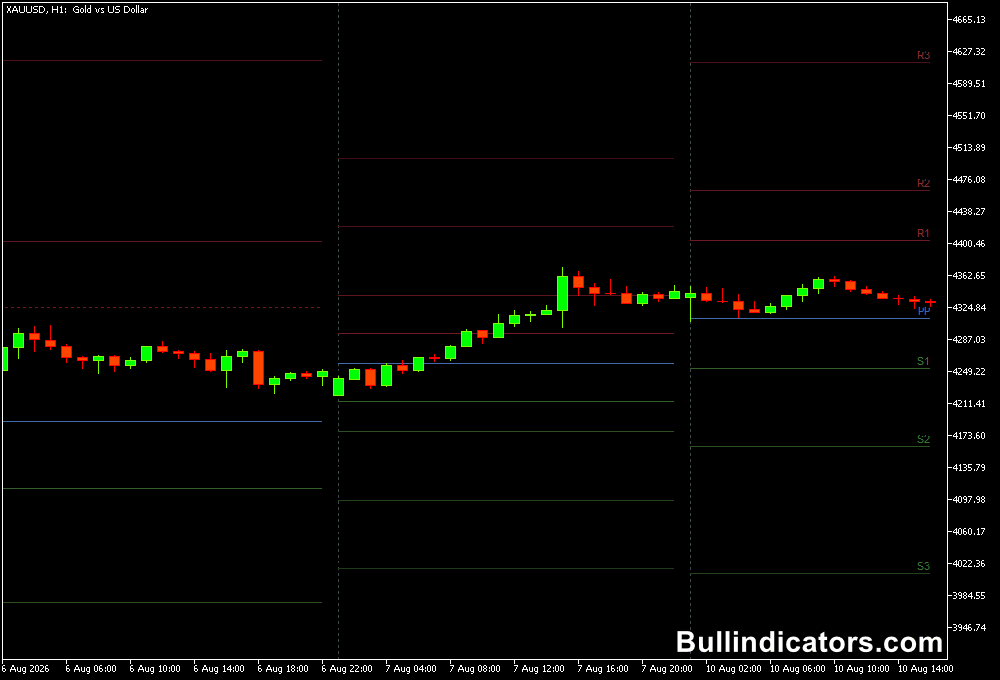
The selected pivot method is displayed directly on the price chart using horizontal levels.
Depending on the chosen calculation, the display can include a central pivot together with multiple support and resistance levels such as S1, S2, S3, S4 and R1, R2, R3, R4.
The timeframe used for the calculation can be selected independently according to the available settings.
For example, daily pivot levels can provide intraday reference points, while higher-period calculations can help identify broader areas where price may react.
CPR has a slightly different presentation because it focuses on three central levels.
When price remains above the CPR range, it can support a bullish market interpretation.
Persistent trading below the range can point toward weaker conditions.
Core Features
- Five pivot calculation methods in one MT5 indicator.
- Classic pivot points for conventional support and resistance analysis.
- Woody method with greater emphasis on the previous closing price.
- Fibonacci pivots for identifying potential correction and trend-resumption areas.
- Camarilla levels designed around closely spaced intraday support and resistance references.
- Central Pivot Range for assessing market direction and the central trading range.
- Supports multiple calculation periods from Daily through Monthly.
- Allows the displayed pivot levels to be limited according to the trading strategy.
Best for
- Identifying potential intraday support and resistance zones.
- Planning entries around established pivot levels.
- Locating logical areas for stop-loss and take-profit placement.
- Finding possible trend continuation after a price correction.
- Assessing whether the market is trending or moving within a range.
- Combining pivot levels with candlestick and price-action analysis.
- Building strategies around predefined daily or higher-timeframe price levels.
Best Markets
- EURUSD: Daily Classic or Fibonacci pivots work well for mapping intraday reaction zones on M15 and H1.
- GBPUSD: Useful for London-session trading where price frequently interacts with established daily levels.
- USDJPY: Suitable for monitoring pivot reactions during Asian and London sessions on M15 and H1.
- EURJPY: Pivot levels can help frame intraday continuation and reversal setups when volatility increases.
- GBPJPY: Camarilla levels can be useful for active intraday strategies on M5 and M15.
- XAUUSD: Daily pivots can provide useful reference areas on M15 and H1, particularly around strong directional moves.
Trading Styles
- Scalping: Camarilla levels can be applied to M5 and M15 charts to identify short-term reaction areas.
- Intraday trading: Daily Classic pivots provide a practical framework for entries, exits and risk management throughout the session.
- Trend trading: Fibonacci pivots can help identify areas where a broader trend may resume following a correction.
- Breakout trading: A sustained move through R1, R2, S1 or S2 can be monitored for evidence of expanding momentum.
- Swing trading: Weekly or Monthly calculations can provide broader support and resistance references on H4 and D1.
- Market bias analysis: CPR on M30, H1 or higher can help assess whether price is maintaining a bullish or bearish position relative to the central range.
How traders use it
The most effective way to use pivot points is to treat them as areas of interest rather than automatic buy or sell signals.
Price approaching S1, for example, does not guarantee a bullish reversal. The reaction around that level is what matters.
How to trade with Pivot Points
A bullish setup can develop when price falls toward support, rejects the level and begins forming higher lows.
A trader could then consider a long entry after confirmation, with the stop placed below the relevant support area. The next pivot level above the entry can provide an initial profit target.
A bearish setup follows the opposite process.
If price rallies into R1 or R2 and begins showing rejection, weakening momentum or lower highs, the area can become a potential short location.
A stop can be positioned beyond the resistance zone, while the next lower pivot can act as a target.
Pivot levels are also useful for managing trades that are already open.
Suppose price moves strongly upward through R1 and approaches R2. Rather than automatically closing the entire position, the reaction around R2 can be monitored.
If momentum remains strong, the position can potentially continue toward the next level. If price begins rejecting R2, partial profit-taking may be appropriate.
Fibonacci pivots have a particularly useful application when the broader trend remains intact after a correction.
For example, during an established bullish move, price may retrace toward S1 or S2.
If the decline begins losing momentum and bullish price action develops around the support level, the area can become a potential location for a trend-continuation entry.
A stop can be positioned beyond the support zone.
The CPR method offers another perspective.
When price consistently remains above the central pivot range, the market can be interpreted as having a stronger bullish bias.
Persistent trading below the range points toward bearish conditions.
This information can then be combined with price action to determine whether an entry is justified.
Get Instant Free Access
Indicator Settings
- Method/Period: Selects the pivot calculation method and timeframe used to display the levels.
- Available Timeframes to Display: Supports calculation periods ranging from Daily to Monthly.
- Show Only Recent Period: Controls whether short, long or standard historical periods are displayed.
- Depth of Levels (Show Up To): Determines which support and resistance levels are visible, from S1/R1 through S4/R4.
- Number of Periods to Show: Sets how many previous calculation periods remain visible on the chart.
Important Notes
- Pivot points identify potential reaction areas but do not guarantee reversals.
- Choose the calculation method according to the market and trading timeframe rather than using every available level simultaneously.
- Too many historical levels can make the chart harder to interpret, so limiting the displayed periods can be useful.
- Confirmation from price action, momentum or trend analysis can improve the quality of pivot-based setups.
- Classic pivots are widely followed, while Fibonacci, Camarilla, Woody and CPR can provide different perspectives on the same market.
- Stop-loss placement should account for current volatility and the distance between nearby pivot levels.
- Pivot levels can be especially useful for defining trade targets because the next support or resistance area provides a predefined price reference.
- No pivot calculation method should be treated as a standalone trading system. Combining the levels with a broader strategy provides better context for deciding when to enter and exit.









