
The Cronex Impulse Indicator for MT5 is a modified MACD-based momentum tool designed to combine trend direction and momentum analysis in one display.
It uses a moving average filter together with a histogram to help identify whether bullish or bearish pressure is gaining strength.
The indicator uses two main components.
The moving average provides a broader directional filter, while the histogram tracks changes in momentum around the signal line and zero level.
This combination can help identify trend continuation, momentum shifts and potential breakouts without relying on the standard MACD display alone.
Why traders use the Cronex Impulse Indicator
The main benefit of the Cronex Impulse approach is the additional filtering applied to MACD momentum.
A simple MACD crossover can produce numerous signals when the market is moving sideways.
The Cronex Impulse combines the position of the bars with the moving average and zero level to provide a more selective reading of market conditions.
A bullish environment develops when the MACD moving average moves above zero and the histogram remains above its signal line with an upward pattern.
Bearish conditions are identified when the moving average stays below zero while the bars remain below the signal line.
This makes the indicator useful for traders who want to combine momentum confirmation with the broader trend rather than acting on every individual histogram change.
Download This MT5 Indicator for Free
Indicator Chart Setup
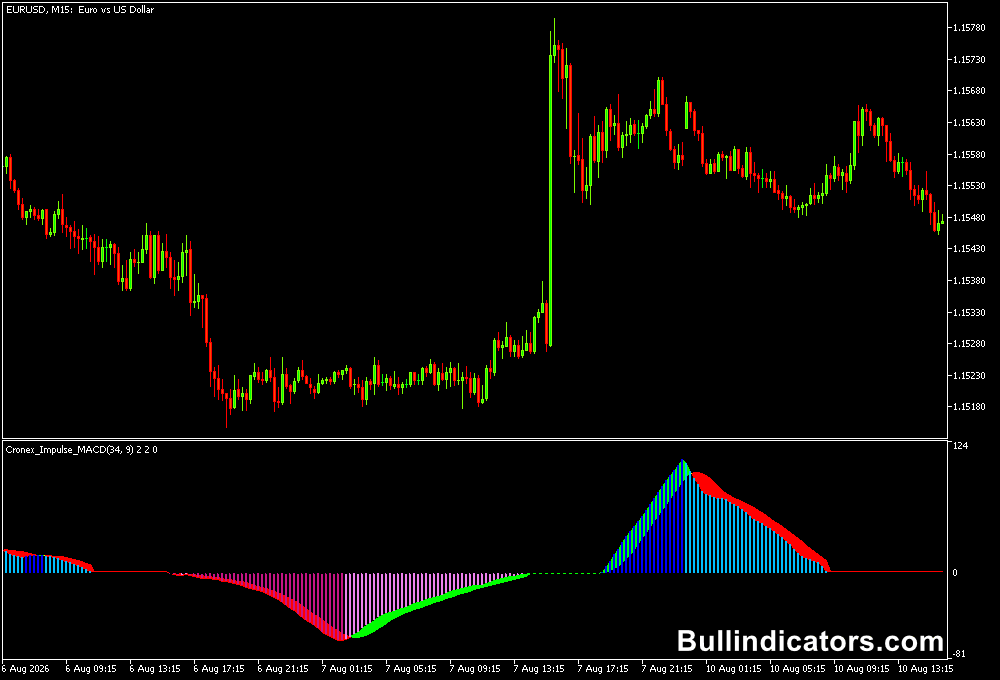
The Cronex Impulse Indicator is displayed in a separate window below the main price chart.
Its histogram shows changes in momentum, while the signal moving average provides a reference for interpreting the bars.
The zero level adds another important filter because the position of the moving average relative to zero helps define the broader directional bias.
When the histogram develops above the signal line while the MACD moving average is above zero, bullish momentum has stronger confirmation.
When the histogram remains below the signal line and the MACD moving average is below zero, bearish pressure is favored.
Core Features
- MACD-based momentum analysis with additional trend filtering.
- Moving average component for identifying the broader directional bias.
- Histogram for monitoring changes in market momentum.
- Zero-line filter for separating bullish and bearish environments.
- Adjustable MACD and signal-line periods.
- Useful for identifying momentum continuation and potential reversals.
- Can be combined with price action and other technical indicators.
Best for
- Confirming the direction of an emerging trend.
- Identifying momentum shifts after periods of consolidation.
- Filtering MACD signals with the zero-line position.
- Finding continuation entries after a breakout.
- Monitoring whether an existing trend is gaining or losing momentum.
Best Markets
- EURUSD: Well suited to trend and momentum setups on M15, H1 and H4.
- AUDUSD: Useful for identifying directional moves following consolidation periods.
- GBPUSD: Can be applied to London-session momentum trades on M15 and H1.
- USDJPY: Suitable for tracking sustained directional movement on H1 and H4.
- US indices: The momentum filter can also be applied to liquid index markets when strong directional movement develops.
Trading Styles
- Intraday momentum: M15 and H1 provide enough movement for histogram and trend confirmation.
- Trend following: H1 and H4 are useful for following broader directional moves.
- Breakout trading: Wait for the histogram and moving average to confirm the direction after price leaves a consolidation range.
- Momentum swing trading: H4 charts can be used to identify longer-lasting shifts in market pressure.
- Short-term trading: M5 can be used when the market is moving strongly, although additional confirmation is recommended.
How traders use it
A bullish setup develops when the MACD moving average crosses above zero and remains there while the histogram bars move above the signal line with an upward pattern.
This combination suggests that both the broader momentum filter and shorter-term momentum are aligned.
For a bearish setup, the MACD moving average should remain below zero while the histogram bars move below the signal line and maintain a downward pattern.
A break below a nearby support zone can provide additional confirmation before considering a short entry.
One practical method is to wait for price to leave a consolidation range after the Cronex Impulse has already established a directional bias.
A bullish breakout accompanied by a bullish indicator reading can provide a continuation setup. The opposite conditions can be used for bearish breakouts.
Example with the EMA MT5 indicator
The indicator can also be combined with the EMA Indicator for MT5.
Candles trading above the EMA can be treated as a bullish market condition, while candles remaining below the EMA indicate bearish conditions.
This gives the Cronex Impulse reading a price-based trend filter.
Example: Cronex Impulse + EMA
- Bullish bias: Price trades above the EMA while the Cronex MACD moving average is above zero.
- Momentum confirmation: Histogram bars move above the signal line and begin developing an upward pattern.
- Entry: Consider a long position after bullish price action confirms the continuation or breakout.
- Bearish bias: Candles remain below the EMA while the Cronex MACD moving average stays below zero.
- Momentum confirmation: Histogram bars cross below the signal line and maintain a bearish pattern.
- Entry: A short setup becomes more interesting when price also breaks below a nearby support level.
- Exit: The next significant support or resistance zone can be used as a target, while a reversal in the indicator can provide an additional exit signal.
Get Instant Free Access
Indicator Settings
- Period MACD: Sets the main moving average period used in the MACD calculation.
- Signal Line Period: Determines the period of the signal moving average used to evaluate the histogram.
- Colors: Controls the visual appearance of the indicator components.
Important Notes
- The strongest setups generally occur when the MACD direction, histogram momentum and price trend point in the same direction.
- Sideways markets can produce conflicting histogram movements and weaker signals.
- A move through the zero level should be considered together with the behavior of the histogram.
- Higher timeframes can reduce some of the noise found on very short charts.
- Using an EMA, support and resistance or price-action confirmation can help filter marginal signals.
- Risk should be defined before entering a position, particularly when trading volatile instruments.
The Cronex Impulse Indicator provides a practical way to combine MACD momentum with a broader trend filter. Its dual confirmation approach can be particularly useful when price is transitioning from consolidation into a sustained directional move.









