
My Price Action Indicator for MT5 is designed to help identify candles where the relationship between the candle body and its upper or lower shadow may reveal significant buying or selling pressure.
Rather than relying on traditional candlestick names alone, the indicator marks specific candles with arrows and labels that draw attention to potentially important price action.
The indicator is particularly useful when price is consolidating around a support or resistance area.
A long lower shadow can indicate that sellers pushed price lower but buyers rejected those prices, while a prominent upper shadow can show rejection of higher prices.
These reactions can provide useful information when combined with the broader market trend and session behavior.
Why traders use My Price Action Indicator
Price action analysis often requires scanning many candles to find meaningful rejection patterns.
My Price Action helps narrow that process by highlighting candles that meet its wick-based conditions.
This can make it easier to focus on areas where the market may be showing a change in buying or selling pressure.
The indicator should be viewed as a price-action detection tool rather than an automatic buy or sell system.
The location of the signal is important. A bullish-looking candle in the middle of a range has less significance than a rejection candle forming at a well-established support level after a decline.
Download This MT5 Indicator for Free
Indicator Chart Setup
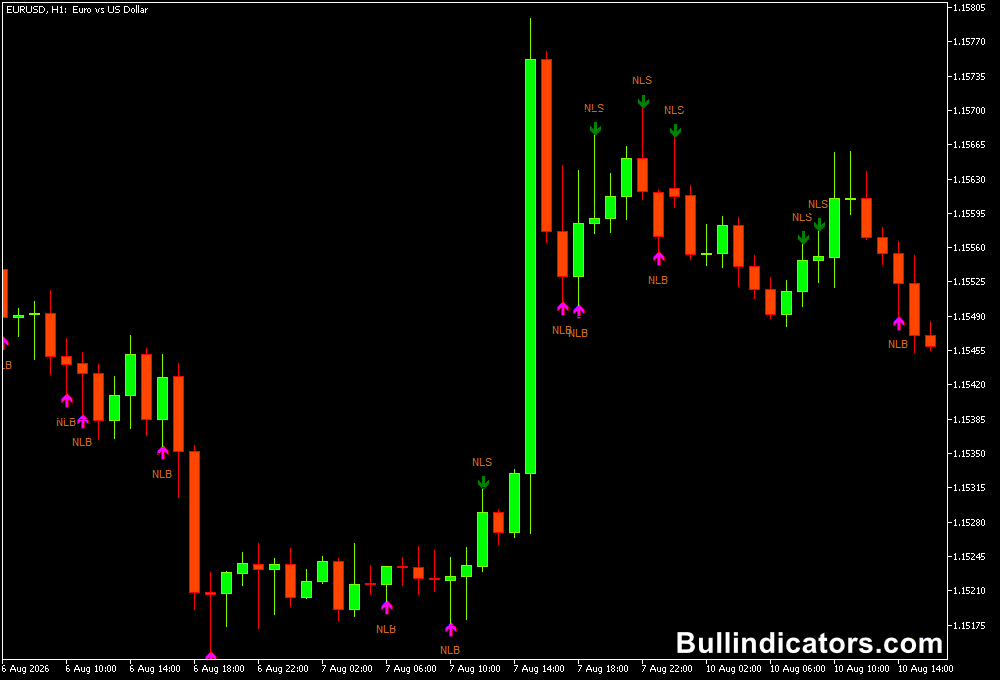
My Price Action places arrows and labels around selected candles.
Pink and green arrows highlight different price-action conditions, while labels such as NLB and NLS identify specific readings generated by the indicator.
The indicator focuses heavily on candle shadows.
Lower-wick signals can point toward buying pressure following a rejection of lower prices, while upper-wick signals can indicate selling pressure after a rejection of higher prices.
Additional options can mark daily highs, daily lows, new highs or lows and specific candlestick formations.
Core Features
- Identifies candles with significant upper or lower shadows.
- Marks selected price-action conditions with arrows and labels.
- Highlights potential buying pressure following lower-price rejection.
- Highlights potential selling pressure following higher-price rejection.
- Can display daily high and daily low levels.
- Includes an option to identify BEOV-style pin-bar formations.
- Can mark new lower lows and higher lows.
- Adjustable wick thresholds allow the signals to be adapted to different markets.
Best for
- Finding rejection candles around support and resistance.
- Identifying potential reversals after a strong price move.
- Filtering consolidation breakouts with candle-based confirmation.
- Studying buying and selling pressure through candle shadows.
- Building price-action strategies around specific session highs and lows.
Best Markets
- EURUSD: Particularly suitable for session-based price action due to its high liquidity during London and US hours.
- GBPUSD: Useful for larger intraday moves around London opens and US economic releases.
- USDJPY: Suitable for rejection and continuation setups during the US session.
- EURGBP: Can provide interesting price-action setups during the European session when ranges form around key levels.
- XAUUSD: The wick analysis can be applied to gold, although wider stops may be required because of its higher volatility.
Trading Styles
- London session trading: M15 and H1 can be used to identify rejection around the Asian range.
- US session trading: M5 and M15 are useful for short-term setups after the London move develops.
- Intraday reversal trading: H1 and H4 can highlight larger rejection candles around important levels.
- Breakout trading: M15 can be used to confirm whether a breakout has genuine follow-through or is being rejected.
- Price-action swing trading: H4 provides more selective signals and reduces the frequency of minor candle reactions.
How traders use it
The most important factor is where the marked candle appears.
A lower-shadow signal near support can indicate that sellers failed to maintain control.
If the next candles move higher and break the signal candle’s high, this can provide stronger confirmation for a long setup.
For a bearish setup, an upper-shadow signal near resistance can indicate rejection of higher prices.
A move below the signal candle’s low can then provide confirmation that sellers are gaining control.
The NLB and NLS readings can be incorporated into a structured price-action strategy.
The original approach uses a higher timeframe and looks for these signals inside or near consolidation zones.
Risk can be defined beyond the rejection shadow, while the opposite price-action signal or a predefined resistance or support area can be used for the exit.
EURUSD London and US Session Example
- London preparation: Mark the Asian session high and low on EURUSD before the London session becomes active.
- London bullish setup: If price sweeps the Asian low and produces a pink-arrow NLB signal with a long lower wick near support, wait for price to break the signal candle’s high before considering a long entry.
- London target: The Asian midpoint, Asian high or another nearby resistance area can provide logical profit objectives depending on the strength of the move.
- US session bearish setup: If EURUSD rallies into the London high and prints a green-arrow NLS signal with a pronounced upper wick, wait for bearish follow-through below the signal candle before considering a short.
- US confirmation: A lower low after the rejection strengthens the setup because price is demonstrating that the upper wick was followed by selling pressure.
- Stop-loss: For a long trade, place the stop below the rejection wick. For a short trade, place it above the rejection wick.
- Trade management: Consider taking partial profit at the next major intraday level and allowing the remainder to run while EURUSD continues making higher lows in a bullish trade or lower highs in a bearish trade.
- Session filter: Avoid forcing a setup when price remains trapped in the middle of the Asian or London range without a meaningful rejection or breakout.
Indicator Settings
- Twick_ratio: Defines the ratio used to evaluate the relationship between the upper and lower candle components.
- Hightwick1: Sets the first upper-wick height threshold in pips.
- Hightwick2: Sets the second upper-wick height threshold in pips.
- Lowtwick1: Sets the first lower-wick height threshold in pips.
- Lowtwick2: Sets the second lower-wick height threshold in pips.
- ShowDH: When enabled, displays the daily high on the chart.
- Show BEOV: Displays BEOV-style candle formations, similar to a pin bar.
- ShowDL: Displays the daily low on the chart.
- ShowB4: Displays new lower lows or higher lows.
- Txt: Allows the color of the indicator labels to be customized.
Important Notes
- Do not treat every arrow as an automatic entry signal. The location of the candle is critical.
- Signals around established support, resistance, session highs and session lows generally provide better context than signals in the middle of a range.
- A rejection candle becomes more useful when subsequent price action confirms the direction.
- London and US sessions can produce rapid moves, so stop-loss distance should reflect current EURUSD volatility.
- Backtest the selected wick settings before using them as fixed rules on a live account.
- Combining the indicator with market structure and key price levels can provide a more complete trading framework.









