
The Volatility Quality Indicator for MT5 combines volatility analysis and trend strength in a single indicator window.
Rather than displaying volatility as a simple numerical reading, it plots a directional line that changes color as market conditions develop.
Arrow signals and alerts provide additional information when the indicator detects a potential change in direction.
The multi-timeframe capability is one of its useful features.
A trader can use a higher timeframe for the underlying market bias while monitoring a lower timeframe for an entry.
This makes the indicator suitable for trend following, breakout trading and intraday strategies where changes in volatility can have a significant impact on price movement.
Why traders use the Volatility Quality Indicator
Volatility and trend strength are closely connected. A market can remain directionless while volatility contracts, then suddenly expand when price breaks away from a consolidation area.
The Volatility Quality Indicator helps monitor these changes through its directional line and signal markers.
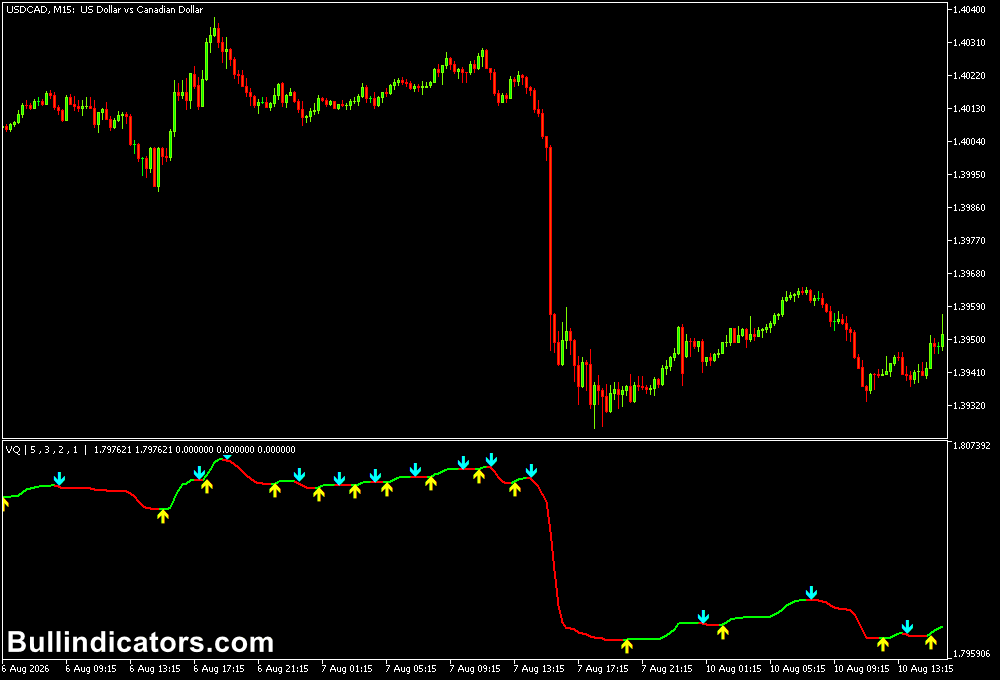
The line remains lime while bullish conditions persist and changes to red when bearish conditions take control.
Arrow signals can draw attention to potential transitions, while alerts make it possible to monitor the indicator without continuously watching the chart.
The multi-timeframe functionality also allows the calculation to be based on a timeframe different from the active chart.
For example, an H1 reading can be used as the directional filter while entries are searched for on M5 or M15.
Download This MT5 Indicator for Free
Indicator Chart Setup
The Volatility Quality Indicator is displayed in a separate window below the price chart. Its main line changes between lime and red according to the calculated market condition.
Arrows provide additional signal information, while alerts can notify you when a new signal occurs.
The indicator can also be configured to calculate data from another timeframe.
This makes it possible to keep a higher-timeframe volatility reading visible while executing trades from a faster chart.
Core Features
- Measures market volatility using historical price information.
- Provides a directional volatility-quality line.
- Lime line indicates bullish conditions.
- Red line indicates bearish conditions.
- Arrow signals identify potential changes in market direction.
- Multi-timeframe calculation capability.
- Real-time signal option.
- Configurable smoothing and filtering.
- Optional alerts and email notifications.
Best for
- Monitoring changes in volatility during developing trends.
- Confirming directional conditions before entering a trade.
- Filtering breakout setups with a volatility-based reading.
- Combining higher-timeframe direction with lower-timeframe entries.
- Managing trend-following positions while volatility remains supportive.
Best Markets
- EURUSD: A strong choice for multi-timeframe intraday analysis on M15 and H1.
- USDCHF: Useful for quieter directional periods where changes in volatility can help identify emerging moves.
- AUDUSD: Suitable for breakout and trend strategies, particularly around active market sessions.
- GBPJPY: Its larger price swings make it suitable for studying volatility expansion on M15 and H1.
- US30: Can be used to monitor volatility and directional momentum during the US trading session.
- XAUUSD: Useful for identifying periods when gold moves from consolidation into stronger directional conditions.
Trading Styles
- Intraday trading: Use H1 as the directional reference and M15 for entry timing.
- Scalping: M5 can be combined with an M15 or H1 volatility reading when market activity is strong.
- Breakout trading: Monitor a contraction period and wait for the indicator to support the direction of the price breakout.
- Trend following: H1 and H4 can help identify sustained volatility and directional conditions.
- Multi-timeframe trading: Use D1 or H4 to establish the broader bias, then use M15 or M5 to refine entries.
How traders use it
A simple method is to first establish the directional condition from the indicator line.
A lime reading can support bullish setups, while a red reading can support bearish setups.
The signal becomes more interesting when price action agrees with the indicator rather than relying on the color change alone.
Bullish and bearish breakout tips
For a bullish breakout, for example, price can first consolidate below a resistance level while volatility remains contained.
If price breaks above resistance and the Volatility Quality line turns or remains lime, the combination can provide confirmation that the breakout has increasing directional support.
For bearish conditions, the same principle applies below support.
A break through a well-defined support area combined with a red Volatility Quality reading can provide a potential short setup.
The next support or resistance level can then be used as a reference for profit management.
The multi-timeframe function is particularly useful for reducing conflicting signals.
A bullish H1 reading combined with a temporary red M5 signal can represent a pullback rather than a complete trend reversal.
Once the lower timeframe returns to bullish conditions, the setup may offer an opportunity to join the larger move.
EURUSD London Session Example
- Use H1 as the higher-timeframe calculation to establish the broader volatility direction.
- Wait for EURUSD to approach or break an important level around the Asian session range during London trading.
- A lime Volatility Quality line on H1 supports looking for long opportunities rather than shorting every temporary pullback.
- Move to M5 or M15 and wait for price to break the local consolidation range.
- A bullish arrow or renewed lime reading on the lower timeframe can provide additional confirmation.
- Place the stop below the recent intraday swing low and use the next resistance area as an initial profit reference.
US Session Example
- Keep the H1 calculation active to maintain the broader directional filter.
- If EURUSD remains below a major resistance area and the H1 line is red, focus on bearish opportunities during the US session.
- Wait for M15 price action to reject resistance or break below a nearby support level.
- A red arrow together with a red indicator line provides additional bearish confirmation.
- The stop can be positioned above the rejection swing, while the next lower support area provides a logical target.
Get Instant Free Access
Indicator Settings
- TimeFrame: Selects the timeframe used for the volatility calculation and allows multi-timeframe analysis.
- Length: Determines the moving average length used in calculating volatility.
- Method: Selects the moving average calculation method.
- Smoothing: Controls the smoothing period applied to the indicator.
- Filter: Applies an additional filter to the calculated readings.
- RealTime: Controls whether signals are provided in real time.
- Steady: Adds another smoothing filter to reduce fluctuations in the reading.
- Color: Controls the appearance of the Volatility Quality line.
- Alerts: Enables or disables signal alerts.
- EmailON: Enables email notifications when a signal occurs.
Important Notes
- Volatility expansion does not automatically indicate the direction of the next price move.
- Use support, resistance and price action to determine whether a signal has a suitable trading location.
- Lower timeframes can generate more frequent changes during choppy conditions.
- A higher-timeframe calculation can help filter short-term signals that oppose the broader market direction.
- Different currency pairs have different volatility characteristics, so settings may require adjustment.
- Alerts are notifications of indicator conditions and should not be treated as automatic trade instructions.
- Risk management remains important when trading instruments with rapid volatility expansion.
The Volatility Quality Indicator is most useful when its volatility reading is combined with market context.
Its multi-timeframe functionality makes it particularly practical for building a directional filter before searching for entries on a faster chart.









