
The Multi Time Frame Breakout indicator for MT4 automatically identifies trendlines around price consolidation and monitors them for potential breakouts.
When price pushes through an ascending or descending trendline, the tool can alert you through MT4, allowing you to assess the move while it is developing.
Its multi-timeframe functionality also makes it useful for traders who want to monitor breakout levels from different chart periods.
A breakout on a higher timeframe can provide an important reference for entries on a lower chart, while waiting for the candle to close helps reduce the risk of reacting to temporary price spikes.
Why traders use the Multi Time Frame Breakout Indicator
Breakouts can develop quickly, particularly around major forex sessions and periods of consolidation.
Automatically plotted trendlines make it easier to monitor these areas without having to draw every level manually.
The alert function is another useful feature.
Once a breakout occurs, the notification brings attention to the chart so you can check whether the move has genuine follow-through.
Many traders also wait for a retest of the broken trendline before entering, which can provide a more controlled setup.
Download This MT4 Indicator for Free
Download “multi-time-frame-breakout-indicator.ex4” Indicator
Indicator Chart Setup
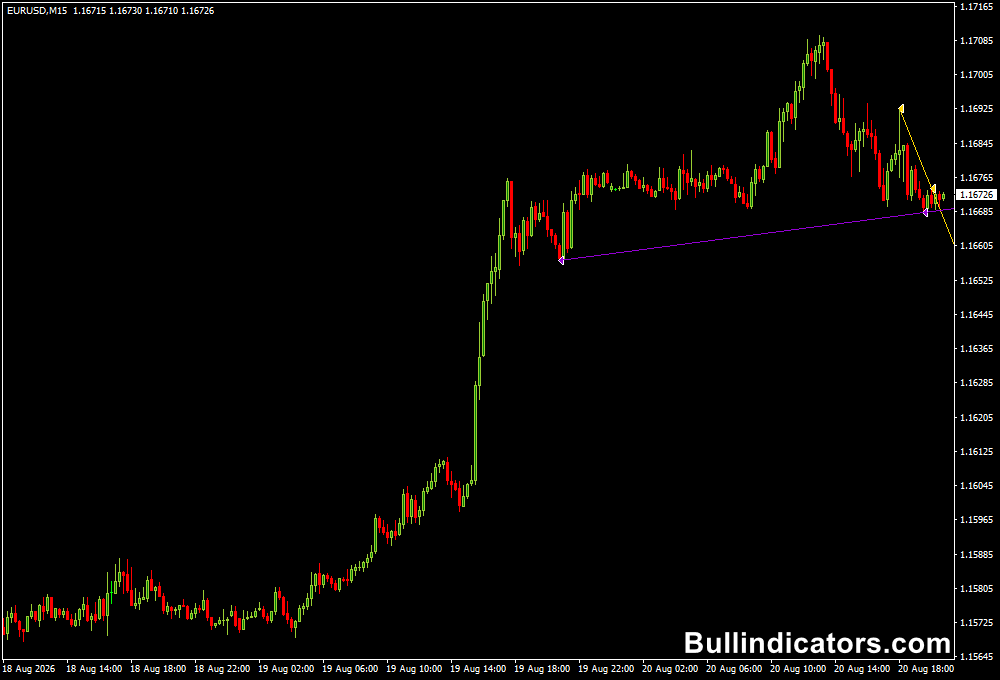
The indicator plots ascending and descending trendlines around price swings and consolidation areas.
These lines establish potential breakout boundaries on the MT4 chart. When price breaks through one of the lines, the popup alert can notify you of the event.
The chart timeframe can be selected through the settings, allowing the tool to be adapted to different trading approaches.
On lower timeframes, the setup can be useful for short-term breakout trades, while H1 and H4 charts can provide broader breakout levels for intraday and swing positions.
Core Features
- Automatic trendline detection using fractal points
- Multi-timeframe breakout analysis
- Ascending and descending trendline identification
- Popup alerts when a breakout occurs
- Optional alerts on current tick movements
- Adjustable distance between fractals
- Option to focus on the two most recent fractals
Best for
- Trading trendline breakouts
- Monitoring consolidation ranges
- London and New York session setups
- Multi-timeframe price-action strategies
- Breakout-and-retest entries
Best Markets
- EURUSD: Particularly suitable for intraday breakout trading because of its high liquidity and generally tight spreads.
- GBPUSD: Useful during the London session when volatility increases around major price levels.
- USDJPY: A good candidate for M15 and H1 breakout setups during the active European and US sessions.
- AUDUSD: Can provide interesting consolidation breakouts around the Asian-to-London transition.
- Major stock indices and Gold: Worth testing when strong directional momentum develops around important market events.
Trading Styles
- Intraday breakout trading
- London-session trading
- Breakout scalping on M5 and M15
- Multi-timeframe price action
- Breakout-and-retest strategies
- Swing breakout setups on H1 and H4
How traders use it
A useful method is to wait for the alert and then allow the breakout candle to close.
This helps distinguish a genuine break from a temporary move through the trendline.
More conservative entries can wait for price to return to the broken line and confirm it as new support or resistance.
EURUSD on M15
For example, consider EURUSD on the M15 chart during the London session.
Suppose price spends several candles consolidating below a descending trendline.
The indicator alerts when a bullish breakout occurs. Wait for the M15 candle to close above the line.
A BUY can then be considered, with the stop loss below the latest swing low and the target placed around the next resistance area.
For a bearish setup, look for an ascending trendline supporting price.
Once EURUSD breaks below that line and the M15 candle closes underneath it, a SELL setup can develop.
The stop loss can sit above the recent swing high, while the next support zone provides a logical profit target.
For stronger confirmation, the breakout can be combined with a trend filter such as a moving average or RSI.
Checking the higher timeframe can also help determine whether the breakout is aligned with the broader market direction.
Get Instant Free Access
Indicator Settings
- TimeFrame: Sets the timeframe used for the breakout calculation. A value of 0 uses the current chart timeframe.
- MinimumDistance: Determines the minimum distance required when forming trendlines between price points.
- MaxBarsBetweenFractals: Controls the maximum number of bars allowed between fractal points.
- OnlyByTwoLastFractals: When enabled, the calculation uses the two most recent fractals.
- PopupAlert: Enables or disables popup notifications when a breakout occurs.
- PopupAlert_ByCurrentTick: When enabled, alerts can be generated as price breaks the trendline during current tick movements.
- Colors: Allows the displayed trendline colors to be adjusted.
Important Notes
- Wait for the breakout candle to close before treating the move as confirmed.
- A retest of the broken trendline can provide additional confirmation for the entry.
- False breakouts are possible, particularly during quiet or ranging conditions.
- Use a logical swing high or swing low when positioning the stop loss.
- Higher-timeframe levels can help filter weaker lower-timeframe breakout signals.
- Test different settings across the currency pairs and timeframes you intend to trade.









