
The CCI Divergence indicator for MT5 automatically detects divergence between price and the Commodity Channel Index (CCI).
Divergence occurs when price and momentum move in different directions, which can provide an early indication that the current market move may be losing strength.
Finding divergence manually requires comparing price highs and lows with the corresponding CCI movements.
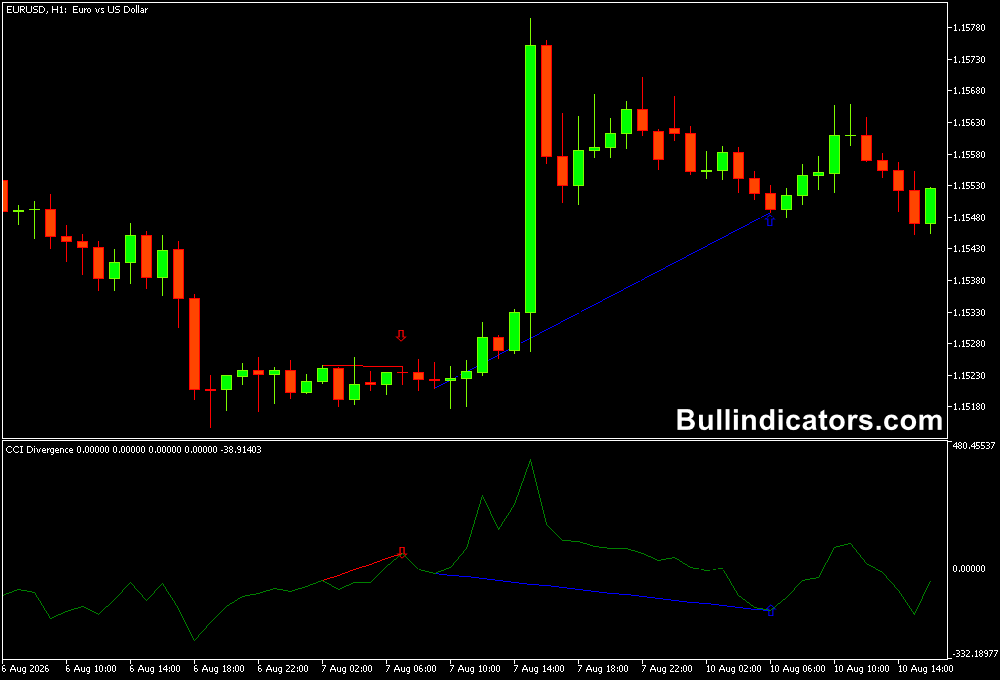
This indicator simplifies the process by highlighting detected divergence on the chart and displaying arrows for potential bullish and bearish setups.
Why Traders Use the CCI Divergence Indicator
CCI divergence can help identify potential turning points after an extended price movement.
Bullish divergence may indicate weakening selling pressure, while bearish divergence may suggest that buying momentum is losing strength.
The indicator marks bullish divergence with blue lines and upward blue arrows.
Bearish divergence is shown with red lines and downward red arrows.
These visual signals make it easier to examine potential reversal areas without manually drawing divergence lines.
Download This MT5 Indicator for Free
Indicator Chart Setup
The CCI Divergence Indicator uses a separate window for the CCI calculation while displaying the detected divergence and directional arrows on the main price chart.
This makes it possible to compare the oscillator movement with price action.
The indicator can be used on different timeframes, although higher timeframes can provide a cleaner view of market structure.
For short-term trading, it can also be applied to lower timeframes such as M5 and M15.
Core Features
- Automatic detection of price and CCI divergence.
- Identifies bullish and bearish divergence.
- Displays bullish and bearish arrows.
- Draws divergence lines between relevant price and CCI points.
- Works across multiple chart timeframes.
- Can be combined with trend indicators and market structure.
Best for
- Divergence trading
- Potential reversal setups
- Momentum analysis
- Pullback entries
- Intraday trading
- Multi-timeframe analysis
Best Markets
- GBPUSD: A liquid pair with frequent intraday swings, making it suitable for spotting divergence on M5, M15 and H1 charts.
- EURUSD: High liquidity and generally tight spreads make it practical for both short-term and intraday divergence setups.
- USDJPY: Useful for identifying momentum shifts around established highs, lows and pullback areas.
- EURJPY: Its regular price swings can provide clear divergence opportunities during active trading sessions.
- GBPJPY: Larger price movements can create noticeable momentum differences between price and CCI, particularly during active market hours.
Trading Styles
- Scalping on M5 and M15
- Intraday trading on M15 and M30
- Short-term trading on H1
- Swing analysis on H4 and D1
How Traders Use It
The CCI Divergence Indicator can be combined with a trend indicator to filter potential reversal signals.
A useful combination is the ADXVMA Histogram Indicator for MT5.
The ADXVMA Histogram uses green bars to indicate bullish conditions and red bars to indicate bearish conditions.
The basic approach is to trade in the direction of the trend while using CCI divergence to look for potential entries after a temporary pullback.
GBPUSD M5 Buy Example
- The ADXVMA Histogram is showing green bars, indicating bullish conditions.
- GBPUSD makes a short-term pullback on the M5 chart.
- The CCI Divergence Indicator identifies bullish divergence as price moves lower while CCI forms a higher low.
- A blue bullish arrow appears after the divergence is detected.
- The setup has additional trend confirmation because the ADXVMA Histogram remains green.
- A buy entry can be considered after price confirms the reversal with a bullish candle or a break above a nearby short-term high.
- A stop loss can be placed below the recent swing low, with the target based on the next resistance area or a predefined risk-to-reward level.
GBPUSD M5 Sell Example
- The ADXVMA Histogram is showing red bars, indicating bearish conditions.
- GBPUSD makes a temporary upward retracement on the M5 chart.
- The CCI Divergence Indicator detects bearish divergence as price moves higher while CCI forms a lower high.
- A red bearish arrow appears following the divergence signal.
- The setup has additional trend confirmation because the ADXVMA Histogram remains red.
- A sell entry can be considered after bearish price confirmation, such as a rejection candle or a break below a nearby short-term low.
- A stop loss can be placed above the recent swing high, with the target based on the next support area or a predefined risk-to-reward level.
Trade in the Direction of the Trend
The ADXVMA Histogram can help filter the CCI divergence signals by keeping your focus on the prevailing trend.
When the histogram is green, focus on bullish divergence and potential buy setups. When the histogram is red, focus on bearish divergence and potential sell setups.
This gives each indicator a specific role.
The ADXVMA Histogram Indicator for MT5 helps identify the market direction, while the CCI Divergence Indicator helps locate potential entry points within that direction.
Get Instant Free Access
Indicator Settings
- Period: Sets the period used for the CCI calculation.
- Applied Price: Selects the price type used for the CCI calculation.
- Colors: Controls the indicator colors.
The CCI period can be adjusted according to the selected market and timeframe. Test different settings on historical charts before applying them to live trading.
Important Notes
- Divergence identifies a potential change in momentum, not a guaranteed reversal.
- Use price action or market structure to confirm entries.
- Trade in the direction of the ADXVMA Histogram when using it as a trend filter.
- M5 trading can produce frequent signals and additional market noise.
- Use appropriate position sizing and stop-loss management.









