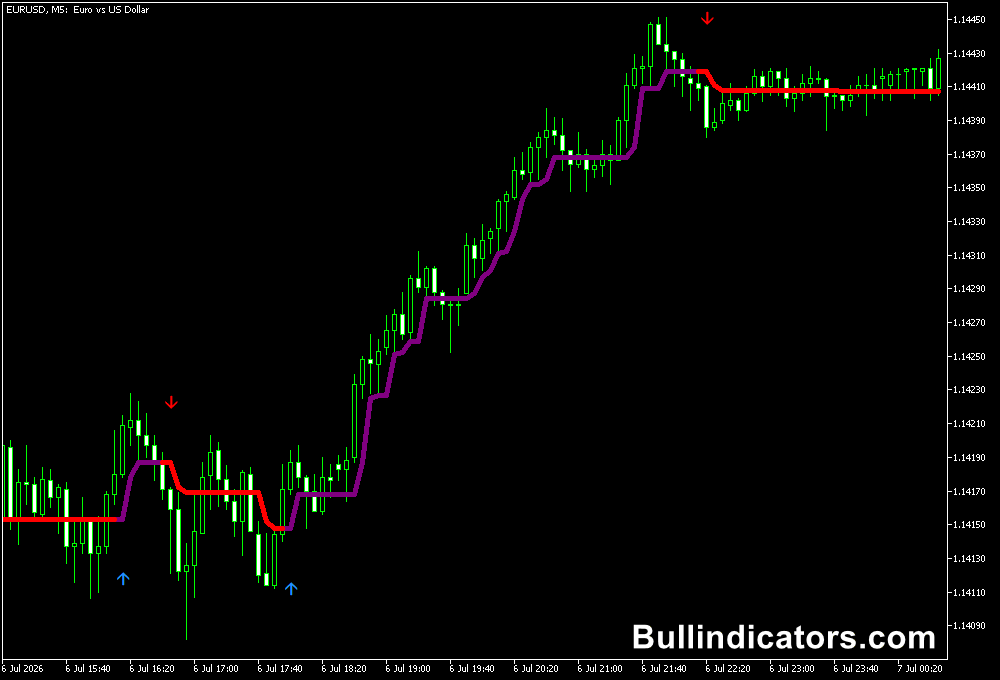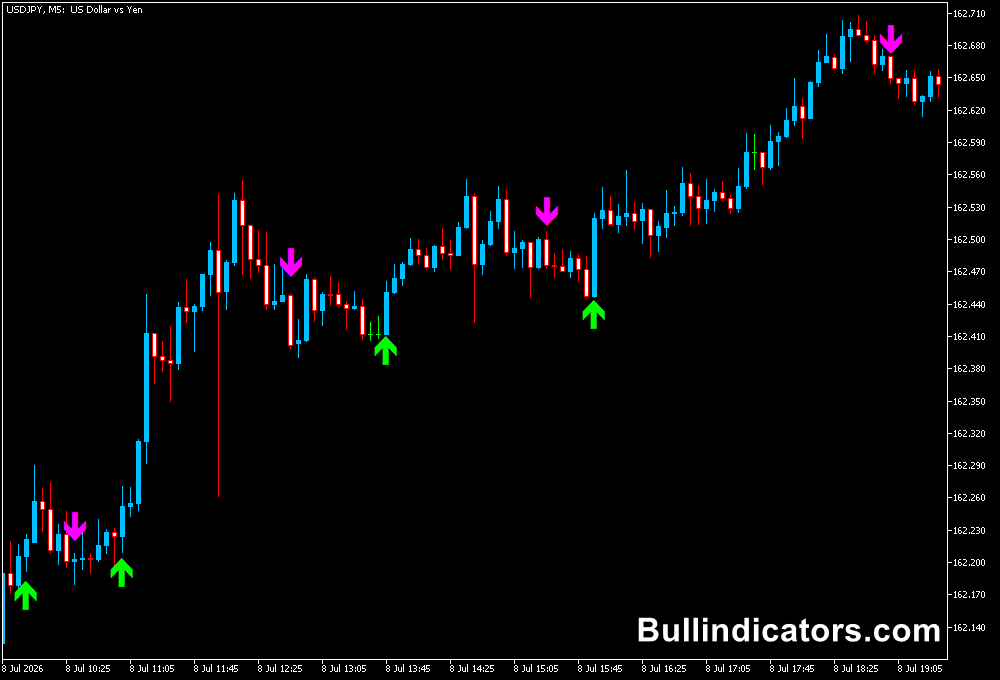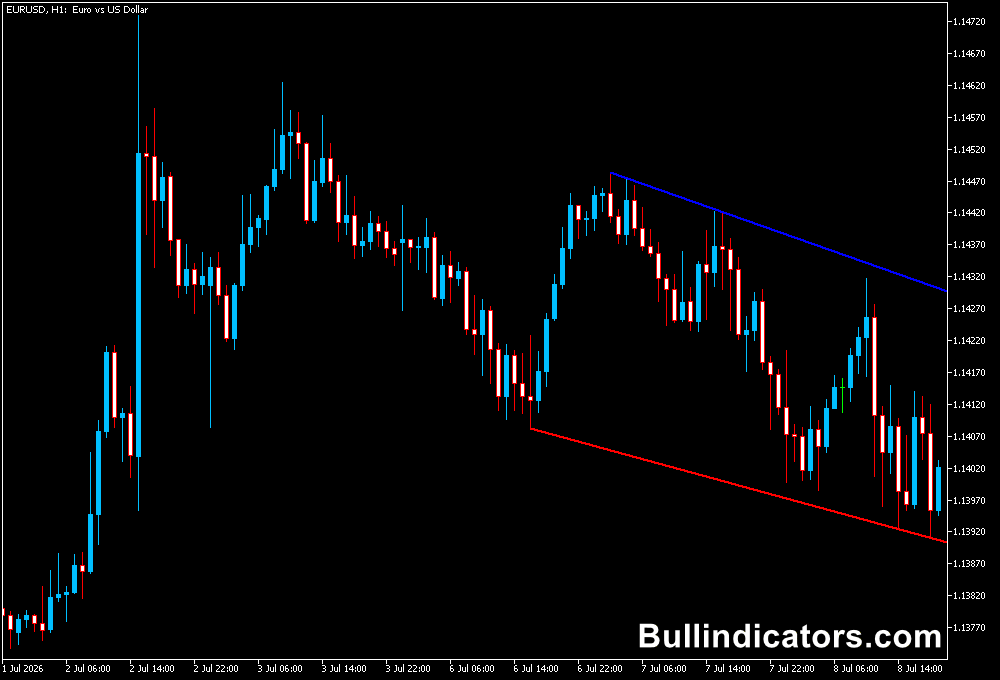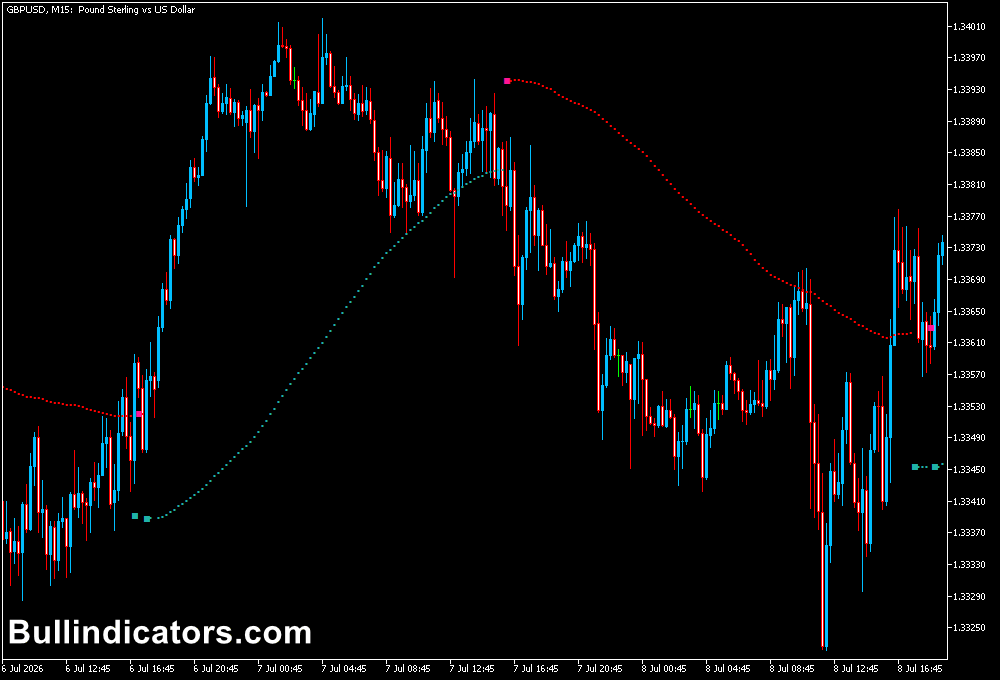
The Chaikin Money Flow Indicator for MT5 measures buying and selling pressure by combining price action with volume data.
It helps identify whether an asset is experiencing accumulation or distribution, providing additional insight into the strength behind a price movement.
The indicator oscillates around a zero line.
Positive readings suggest bullish pressure, while negative readings indicate bearish pressure.
Changes in the indicator’s direction can also help identify shifts in market momentum, making it useful for trend analysis and short-term trading strategies.
For scalping, the Chaikin Money Flow Indicator can be combined with the Trend Scalp Indicator for MT5.
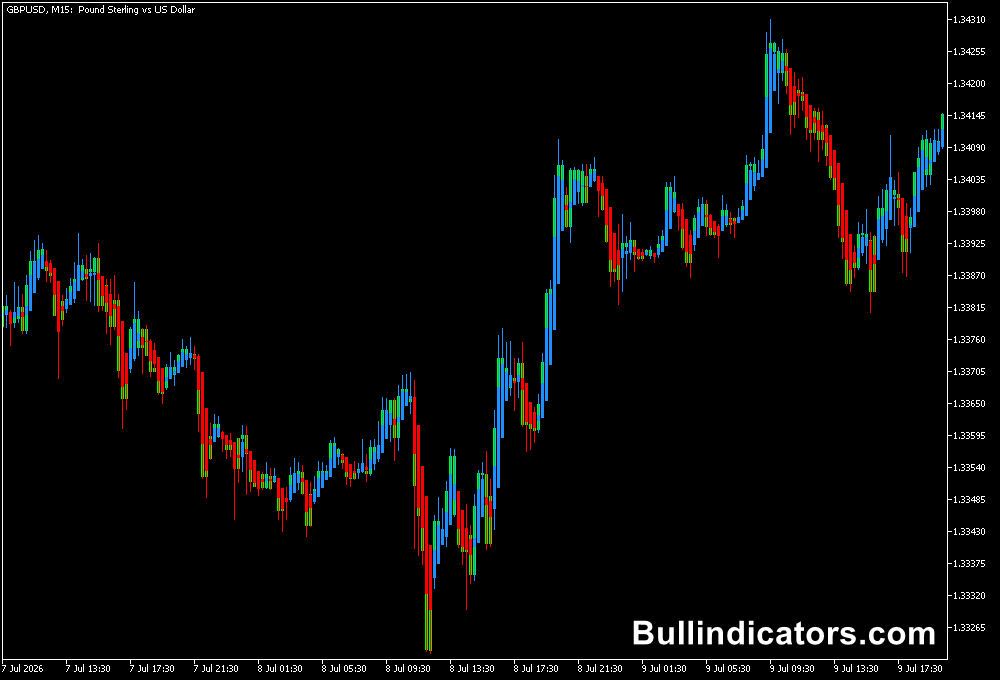
The two indicators provide complementary information: Chaikin Money Flow evaluates buying and selling pressure, while Trend Scalp displays directional signals through a colored histogram.
Why Traders Use the Chaikin Money Flow Indicator
Price movements do not always reveal the strength of the underlying buying or selling activity.
Chaikin Money Flow adds another perspective by examining where prices close within their trading ranges and incorporating volume into its calculation.
When CMF moves above zero, buying pressure is gaining the upper hand.
Readings below zero indicate that selling pressure is dominant.
These signals help assess whether a developing trend has directional support or whether momentum may be weakening.
For short-term strategies, the indicator can help filter entries generated by a separate trend indicator.
This combination is particularly useful when scalping currency pairs during active trading sessions, when rapid price movements can create frequent entry opportunities.
Download This MT5 Indicator for Free
Indicator Chart Setup
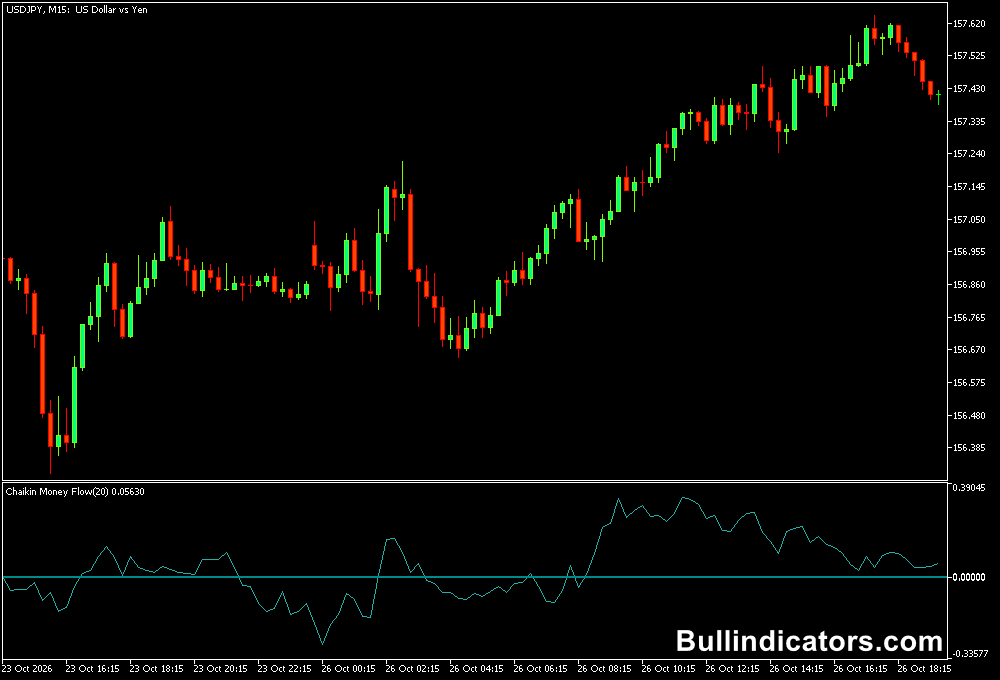
The Chaikin Money Flow Indicator appears in a separate window beneath the main price chart.
Its line fluctuates around a central zero level, allowing you to compare changes in buying and selling pressure with the corresponding price action.
When the line rises above zero, bullish pressure is indicated. A move below zero suggests bearish pressure.
The steepness and direction of the line provide additional context about changes in market participation.
During an uptrend, rising CMF readings can support a bullish interpretation of price action.
During a downtrend, falling readings can reinforce the bearish outlook.
Crosses above or below zero may help identify changing conditions, although confirmation from price structure remains important.
Core Features
- Measures buying and selling pressure using price and volume data.
- Displays positive and negative readings around a zero line.
- Helps assess the strength behind bullish and bearish movements.
- Highlights potential changes in market pressure.
- Supports trend analysis and confirmation of trading signals.
- Offers adjustable calculation periods and volume selection.
Best For
- Confirming bullish and bearish market conditions.
- Evaluating whether a price trend has supporting buying or selling pressure.
- Filtering short-term entries generated by other indicators.
- Identifying potential shifts in market direction.
Best Markets
- EURUSD and GBPUSD: Suitable for analyzing directional pressure during the London and New York sessions.
- USDJPY: Useful for monitoring buying and selling pressure during active Asian and US trading hours.
- XAUUSD (Gold): Can help assess directional pressure during strong intraday movements.
- Stock indices: Designed around price and volume analysis, the CMF concept can also be applied to instruments with suitable volume data.
Trading Styles
- Scalping: Combine CMF with Trend Scalp on M1 or M5 charts to filter short-term entries.
- Intraday trading: Use M15 and M30 charts to assess directional pressure during active sessions.
- Trend following: Monitor H1 and H4 charts to evaluate whether buying or selling pressure supports the prevailing direction.
- Momentum confirmation: Check whether CMF readings agree with a developing price move before entering.
How Traders Use the Chaikin Money Flow Indicator
A common approach is to compare the indicator’s position relative to zero with the current price structure.
A positive reading supports a bullish bias, while a negative reading supports a bearish bias.
Some traders also monitor whether the line is rising or falling to evaluate changes in pressure.
For stronger confirmation, combine the reading with a breakout, a pullback to support or resistance, or a signal from a directional indicator.
A zero-line cross alone is not sufficient to establish a reliable entry, particularly when the market is moving sideways.
Scalping Strategy: Combining Chaikin Money Flow with Trend Scalp
The Trend Scalp Indicator for MT5 displays a blue histogram for bullish scalp signals and an orange histogram for bearish scalp signals.
Combining these signals with Chaikin Money Flow provides a way to check whether the short-term direction agrees with the prevailing buying or selling pressure.
The following examples illustrate a possible entry method using EURUSD on the M5 timeframe.
They are hypothetical setups, not verified trading results.
Buy Entry Example
- Market condition: EURUSD begins forming higher lows after a short pullback.
- Chaikin Money Flow: The indicator moves above zero and continues rising, suggesting increasing buying pressure.
- Trend Scalp: The histogram turns blue, indicating a bullish scalp signal.
- Entry: Consider a buy after the blue signal appears and the price confirms the upward move, such as by breaking a nearby short-term high.
- Stop-loss: Place the stop below the recent swing low or another technically justified invalidation level.
- Take-profit: Identify the next resistance level or use a predefined risk-to-reward target.
Sell Entry Example
- Market condition: EURUSD breaks below a short-term support level and begins forming lower highs.
- Chaikin Money Flow: The reading falls below zero and continues declining, indicating stronger selling pressure.
- Trend Scalp: The histogram turns orange, indicating a bearish scalp signal.
- Entry: Consider a sell after the orange signal appears and price action confirms the downward direction.
- Stop-loss: Position the stop above the recent swing high or another technically justified invalidation level.
- Take-profit: Target the next support level or apply a predefined risk-to-reward ratio.
For either setup, avoid entering when the indicators disagree or price action is choppy.
Waiting for both signals to align can reduce some conflicting entries, although it does not eliminate false signals or guarantee profitability.
Get Instant Free Access
Indicator Settings
- Used Periods: Sets the number of periods included in the Chaikin Money Flow calculation. Shorter periods react more quickly to price changes, while longer periods generally produce smoother readings.
- Volumes: Selects the volume data used by the indicator. Available options are Tick Volume and Real Volume. Data availability and interpretation depend on the broker and instrument.
Important Notes
- Positive CMF readings indicate buying pressure, while negative readings indicate selling pressure. Neither condition guarantees that price will continue in that direction.
- Tick volume measures changes in price activity rather than the actual number of contracts or units traded. Real volume may not be available for every instrument or broker.
- CMF can produce false signals in ranging markets. Confirm entries with price structure and additional technical analysis.
- When scalping, account for spreads, commissions, slippage, and execution speed, particularly during volatile market conditions.
- Test the combination of Chaikin Money Flow and Trend Scalp on historical data and in a demo account before using it in live trading.