The Zero Lag MACD indicator for MT5 is a momentum-based trading tool designed to identify bullish and bearish market conditions.
It uses moving average calculations to show changes in trend direction, helping traders evaluate momentum before entering a position.
The indicator displays a MACD histogram and a signal line in a separate chart window.
Histogram bars above the zero line indicate positive momentum, while bars below zero suggest bearish pressure.
The signal line provides additional confirmation, helping distinguish developing momentum from a more established directional move.
For day trading, the Zero Lag MACD can be combined with the Silver Trend Signal Indicator for MT5.
This combination uses MACD to assess market momentum and directional arrows to identify potential entries.
On M5 and M15 charts, the approach can be used to look for intraday moves with a target of 15–30 pips, depending on market conditions and the currency pair.
Why Traders Use the Zero Lag MACD Indicator
Moving average crossovers and momentum changes can help reveal when a market is transitioning from bullish to bearish conditions.
The Zero Lag MACD presents this information through a histogram and signal line, making it easier to compare momentum with the direction of price action.
One useful feature is the ability to check whether both components support the same directional bias.
For example, a histogram that moves above zero while the signal line remains negative may indicate that bullish momentum is developing but has not yet received confirmation from both components.
The indicator can also filter candlestick setups.
A bearish pin bar near resistance carries more weight when MACD momentum is negative, while a bullish reversal candle near support may be more relevant when momentum is positive.
This additional confirmation helps build a consistent approach to trend trading and intraday analysis.
Download This MT5 Indicator for Free
Indicator Chart Setup
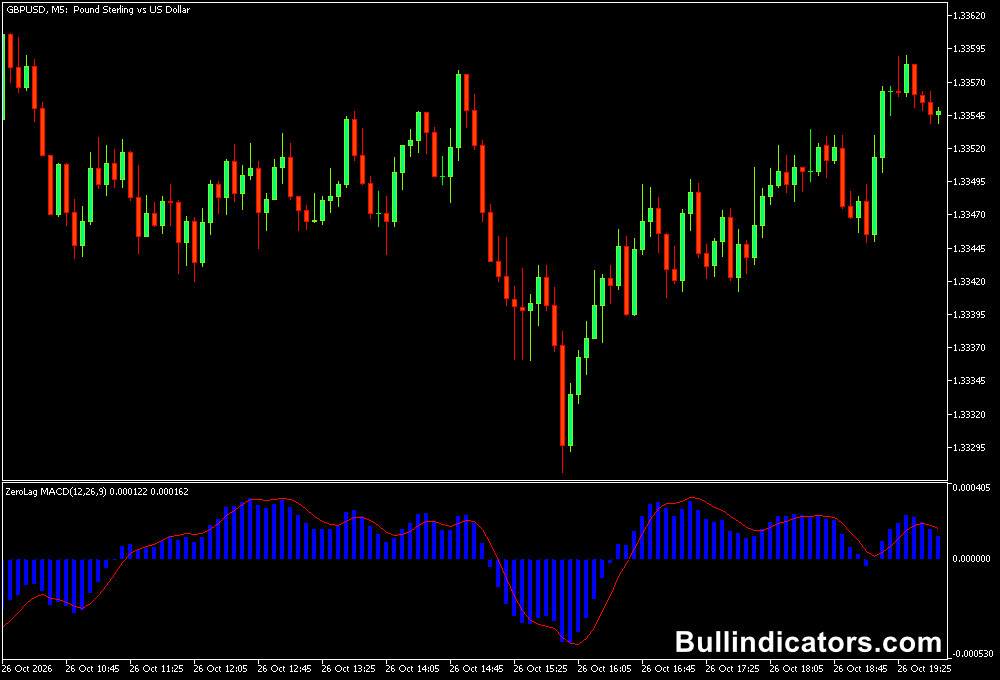
The Zero Lag MACD Indicator appears in a separate window below the price chart.
Its histogram illustrates changes in momentum around a zero line, while a red signal line represents the smoothed MACD value.
When the histogram rises above zero and the signal line also becomes positive, the market has a bullish momentum bias.
When both move below zero, bearish momentum is indicated.
Histogram bars that begin shrinking can signal weakening momentum, even if they remain on the same side of zero.
The indicator uses fast, slow, and signal EMA parameters to calculate its readings.
Although its zero-line signals are straightforward to interpret, confirmation from price structure and the broader market trend remains important.
Core Features
- Identifies bullish and bearish momentum through a MACD histogram.
- Displays a signal line for additional trend confirmation.
- Highlights transitions between positive and negative momentum.
- Helps evaluate the strength and direction of an existing trend.
- Supports candlestick pattern confirmation and trend-following strategies.
- Provides adjustable fast EMA, slow EMA, and signal EMA parameters.
Best For
- Identifying intraday trend direction before entering a trade.
- Confirming momentum behind bullish breakouts and bearish breakdowns.
- Filtering reversal candlesticks at support and resistance.
- Monitoring potential momentum changes during established trends.
Best Markets
- EURUSD: Suitable for intraday trend analysis during the London and New York sessions.
- GBPUSD: Useful for evaluating momentum during active trading hours.
- USDJPY: Helps assess directional moves during the Asian and US sessions.
- XAUUSD (Gold): Can be applied to short-term momentum analysis, although price volatility requires careful risk management.
- Major stock indices: Can help evaluate momentum when the relevant instrument and trading conditions are supported by the platform.
Trading Styles
- Scalping: Use M1 or M5 charts to monitor short-term momentum shifts.
- Day trading: Apply the indicator to M5 and M15 charts to identify directional opportunities during active sessions.
- Intraday trend following: Use M15 and M30 charts to filter entries in the prevailing direction.
- Swing trading: Check H1 and H4 charts for broader momentum changes and potential trend continuation.
How Traders Use the Zero Lag MACD Indicator
A straightforward method is to monitor the histogram and signal line relative to zero.
When both turn positive, traders can focus on bullish setups.
When both become negative, bearish setups receive priority.
For additional confirmation, compare the momentum reading with a breakout, a pullback, or a candlestick formation near a significant price level.
Avoid treating every zero-line cross as an entry signal, since sideways markets can generate repeated changes in direction without sustained follow-through.
Day Trading Strategy: Combining Zero Lag MACD with Silver Trend Signal
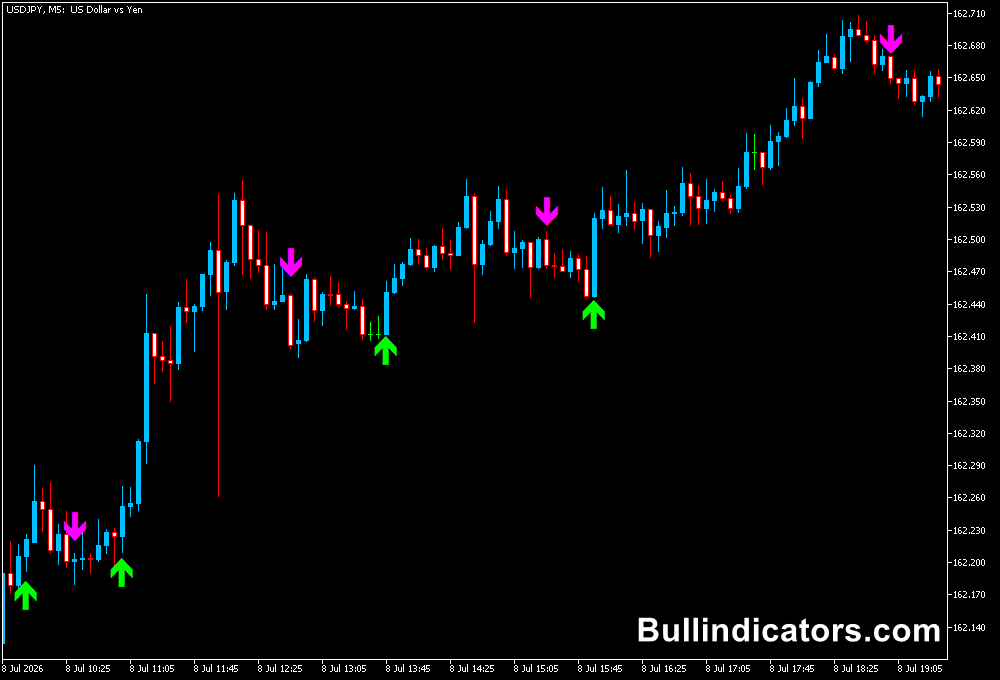
The Silver Trend Signal Indicator for MT5 displays green arrows for potential buy entries and red arrows for potential sell entries.
Combining these arrows with the Zero Lag MACD helps check whether the entry signal agrees with current market momentum.
The following examples illustrate a possible approach on EURUSD using the M5 or M15 timeframe.
A 15–30 pip target may be suitable for some intraday setups, but the achievable move depends on volatility, spread, price structure, and the strength of the trend.
No indicator combination guarantees a particular profit or target.
Buy Entry Example
- Market condition: EURUSD is forming higher lows and moving above a short-term resistance level.
- Zero Lag MACD: The histogram moves above zero, and the red signal line also crosses into positive territory.
- Silver Trend Signal: A green arrow appears, indicating a potential buy opportunity.
- Entry: Consider buying after the green arrow appears and price action confirms the bullish direction.
- Stop-loss: Place the stop below a recent swing low or another technically justified invalidation level.
- Take-profit: Consider a 15–30 pip target when supported by the available price movement and nearby resistance.
Sell Entry Example
- Market condition: EURUSD breaks below short-term support and begins forming lower highs.
- Zero Lag MACD: The histogram moves below zero, and the signal line also turns negative.
- Silver Trend Signal: A red arrow appears, indicating a potential sell opportunity.
- Entry: Consider selling after the red arrow appears and price action confirms continued bearish pressure.
- Stop-loss: Place the stop above a recent swing high or another technically justified invalidation level.
- Take-profit: Consider a 15–30 pip target when the next support level and market conditions provide sufficient room.
For either setup, avoid entering when the arrow signal conflicts with MACD momentum.
Waiting for both indicators to agree can help filter some weaker setups, although false signals remain possible. Always define the stop-loss before entering a trade.
Get Instant Free Access
Indicator Settings
- FastEMA: Sets the period of the faster Exponential Moving Average. A shorter period responds more quickly to recent price changes.
- SlowEMA: Sets the period of the slower Exponential Moving Average, providing the longer-term component used in the MACD calculation. Its value should exceed the FastEMA period.
- SignalEMA: Controls the smoothing period applied to the MACD value to produce the signal line.
Important Notes
- Zero-line crosses can lag behind the initial price movement, so entries may occur after a trend has already started.
- Sideways markets can produce conflicting signals. Check price structure and market conditions before entering.
- Adjust expectations for the currency pair and timeframe. A 15–30 pip target is not equally realistic in every market environment.
- Include spreads, commissions, and slippage in your risk calculations, particularly when trading on M5 charts.
- Backtest the combination with Silver Trend Signal and practise in a demo account before using it with real capital.