
The Fibonacci Retracement Indicator for MT4 automatically plots Fibonacci retracement levels on the chart, allowing traders to identify potential pullback zones without manually drawing the tool.
Rather than calculating retracements during low-volatility conditions, the indicator focuses on meaningful price swings, making the levels more relevant during active market trends.
It helps traders locate areas where a correction may end and the primary trend could resume.
Why traders use the Fibonacci Retracement Indicator
Traders rely on Fibonacci retracement levels to identify high-probability support and resistance zones after a trending move.
The indicator automatically displays the most important retracement levels, making it easier to evaluate where buyers or sellers may return to the market.
The 38.2%, 50%, and 61.8% levels receive the most attention because they frequently act as reversal areas during healthy pullbacks.
A shallow retracement toward 23.6% often reflects a strong trend, while a deeper move toward 61.8% can still present an attractive continuation opportunity.
If price breaks well beyond these levels, traders may begin considering the possibility of a complete trend reversal instead of a temporary correction.
Download This MT4 Indicator for Free
Indicator Chart Setup
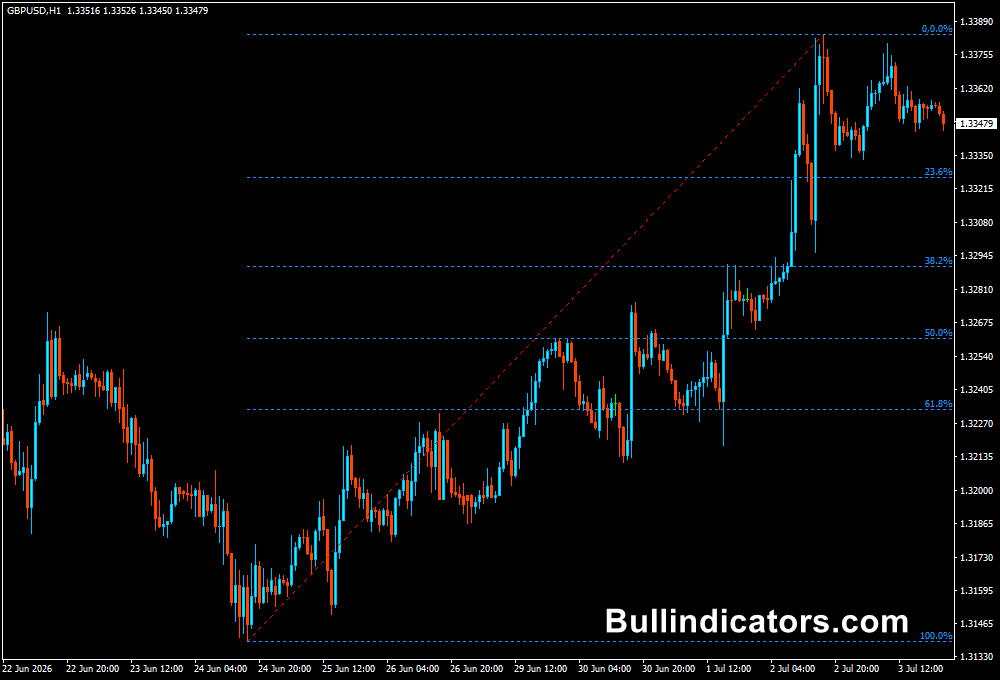
When applied to a MetaTrader 4 chart, the indicator automatically draws Fibonacci retracement levels directly on the main price area between significant swing highs and lows.
The key levels include 0%, 23.6%, 38.2%, 50%, 61.8%, and 100%, giving traders clear reference points for potential pullbacks and continuation trades.
As new market swings develop, the indicator updates the plotted levels to reflect the latest trend structure.
Core Features
- Automatically plots Fibonacci retracement levels
- Highlights potential pullback and reversal zones
- Filters out insignificant market movements
- Works across all MT4 timeframes
- Supports trend continuation analysis
Best for
- Finding pullback entries
- Locating support and resistance zones
- Trading with the prevailing trend
- Planning stop-loss placement
- Confirming technical analysis
Best Markets
- Major Forex pairs such as EUR/USD, GBP/USD, and USD/JPY
- Volatile cross currency pairs such as GBPJPY and EURJPY
- Gold (XAU/USD) and Silver (XAG/USD)
- Stock indices such as the NASDAQ 100 and DAX 40
- Other liquid CFD markets
Trading Styles
- Scalping
- Intraday trading
- Swing trading
- Trend following
- Pullback trading
How traders use it
Many traders first identify the overall market direction before waiting for a retracement into one of the Fibonacci levels.
A bullish trend often presents buying opportunities near the 38.2%, 50%, or 61.8% retracement, while bearish trends may offer selling opportunities after corrective rallies into the same areas.
Stops are commonly placed beyond the next Fibonacci level or the recent swing point.
One effective approach is combining the Fibonacci Retracement Indicator with Bollinger Bands.
For example, if the Bollinger Bands slope upward and price pulls back to the 50% Fibonacci level while touching the lower Bollinger Band, traders have both trend direction and pullback confirmation before considering a BUY position.
The same concept applies in a downtrend when price retraces upward into a Fibonacci level near the upper Bollinger Band.
Get Instant Free Access
Indicator Settings
- Fibonacci Line Color: Changes the color of the Fibonacci retracement levels displayed on the chart.
- Line Style: Selects the appearance of the Fibonacci lines, such as solid, dashed, or dotted.
Important Notes
- The 38.2%, 50%, and 61.8% levels generally receive the most attention from traders.
- Use Fibonacci retracements together with trend analysis for higher-quality setups.
- Additional confirmation from indicators or price action can improve trade selection.
- If changing timeframes, refresh the indicator if the levels are not updated automatically.
- Always apply proper risk management when trading retracement setups.









