
The Volume Profile V6 indicator for MT5 helps traders analyze where the highest and lowest trading activity has occurred over a selected price range.
Rather than focusing only on price movement, the indicator builds a volume profile that reveals where market participants have been most active.
It also identifies the Volume Point of Control (VPOC), the price level with the highest traded volume, which frequently acts as an important support, resistance, or price acceptance area.
Why traders use the Volume Profile V6 Indicator
Volume analysis provides valuable insight into how the market is behaving beneath the price action.
Areas with high trading volume often represent prices where buyers and sellers agreed on value, while low-volume areas tend to be crossed more quickly as the market searches for stronger participation.
The Volume Profile V6 Indicator automatically organizes this information into an easy-to-read histogram beside the price chart.
Traders frequently monitor the VPOC as a key reference level for future price reactions, while high-volume nodes may become important support or resistance zones.
Low-volume areas are commonly watched as potential paths where price can move rapidly once momentum increases.
Download This MT5 Indicator for Free
Indicator Chart Setup
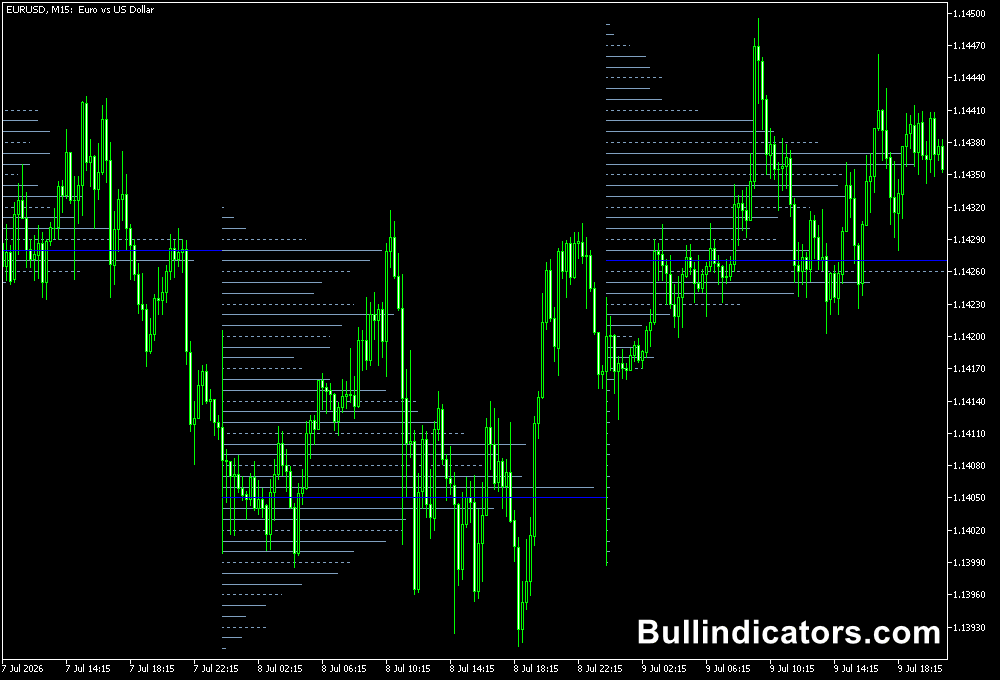
When the indicator is applied, a horizontal volume histogram appears alongside the selected price range.
Larger bars represent prices with greater trading activity, while shorter bars indicate lower participation.
The Volume Point of Control (VPOC) is clearly highlighted, making it easy to locate the most actively traded price level. T
raders can customize the profile appearance, direction, and calculation period to match their preferred trading style.
Core Features
- Builds a detailed volume profile for any selected range.
- Highlights the Volume Point of Control (VPOC).
- Displays high-volume and low-volume price zones.
- Supports both tick volume and real volume data.
- Fully customizable profile appearance.
- Compatible with every MT5 timeframe.
Best for
- Support and resistance analysis.
- Market profile trading.
- Finding institutional trading zones.
- Trade entry and exit planning.
- Price acceptance and rejection analysis.
Best Markets
- High-liquidity Forex pairs where volume clusters form consistently, such as EUR/USD, USD/JPY, and GBP/USD.
- Gold and crude oil, where institutional participation often creates well-defined volume nodes.
- Major equity indices that produce clear volume-based support and resistance throughout the trading session.
- Highly traded cryptocurrency markets, especially Bitcoin and Ethereum, where volume profiles help identify value areas.
- Futures and CFD markets with continuous trading activity and sufficient historical volume data.
Trading Styles
- Scalping.
- Day trading.
- Swing trading.
- Market profile trading.
- Breakout and pullback trading.
How traders use it
Many traders begin by locating the VPOC and evaluating how price behaves around this high-volume area.
Rejections from the VPOC may provide reversal opportunities, while successful breakouts can signal the beginning of a stronger directional move.
High-volume nodes often serve as logical profit targets or support and resistance zones, whereas low-volume areas may indicate regions where price can accelerate with relatively little resistance.
Combining the volume profile with price action or trend analysis often provides stronger trade confirmation.
Get Instant Free Access
Indicator Settings
- Range Period – Selects the chart timeframe used for the volume profile calculation.
- Range Count – Defines how many periods are included in the profile.
- Timeshift – Moves the volume profile forward or backward on the chart.
- Mode Step (Points) – Sets the price interval used to build the profile levels.
- Point Scale – Applies a multiplier to adjust the profile resolution.
- Volume Type – Chooses between Tick Volume or Real Volume, when available.
- Data Source – Selects the source used to calculate trading volume.
- Bar Style – Changes the appearance of the volume profile bars.
- Draw Direction – Displays the histogram to the left or right of the price action.
- Color 1 – Sets the primary color of the profile bars.
- Color 2 – Sets the secondary color used within the profile.
- Line Width – Adjusts the thickness of the histogram bars.
Important Notes
- The VPOC often acts as an important support or resistance level during future price action.
- High-volume nodes frequently become areas where price consolidates or reverses.
- Low-volume zones can lead to faster price movement once momentum increases.
- The indicator works well alongside trend analysis, price action, and market structure techniques.
- Selecting an appropriate calculation range is important for obtaining meaningful volume analysis.









