
The Auto Fibonacci Levels indicator for MT5 automatically draws Fibonacci retracement levels by detecting significant swing highs and swing lows on the chart.
This removes the need to manually place Fibonacci tools, saving time while ensuring consistent analysis.
The indicator plots the most commonly used retracement levels, allowing traders to quickly identify potential pullback zones, support and resistance levels, and possible trend continuation areas across any market or timeframe.
Why traders use the Auto Fibonacci Levels Indicator
Fibonacci retracements remain one of the most popular technical analysis tools because they help identify areas where price may temporarily pause or reverse before continuing its trend.
The challenge for many traders is selecting the correct swing points, which can vary depending on market conditions.
The Auto Fibonacci Levels Indicator eliminates this uncertainty by automatically updating the retracement levels as new market swings develop.
Traders can focus on evaluating price behavior around the key Fibonacci ratios rather than repeatedly adjusting the tool.
It is particularly useful when combined with trend analysis, candlestick confirmation, or horizontal support and resistance.
Download This MT5 Indicator for Free
Indicator Chart Setup
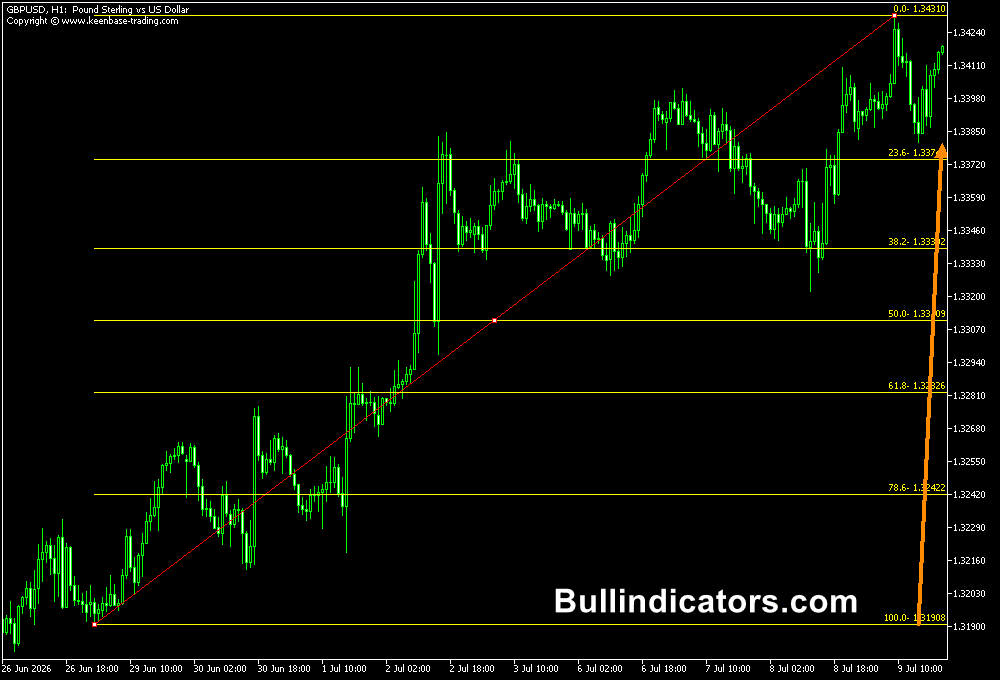
After adding the indicator to the chart, Fibonacci retracement levels are automatically drawn between the latest significant high and low.
The indicator continuously adjusts the retracement as new swings form, ensuring the displayed levels remain relevant to current market conditions.
The familiar percentage levels provide traders with potential pullback zones that can be used for trade entries, stop-loss placement, and profit objectives.
Core Features
- Automatically detects swing highs and swing lows.
- Draws Fibonacci retracement levels without manual input.
- Continuously updates as market structure changes.
- Supports both automatic and manual Fibonacci modes.
- Customizable line colors, styles, and thickness.
- Works on every MT5 timeframe.
Best for
- Finding pullback entry opportunities.
- Trend continuation strategies.
- Support and resistance analysis.
- Planning stop-loss and take-profit levels.
- Multi-timeframe technical analysis.
Best Markets
- Trending currency pairs that frequently produce healthy pullbacks before continuing their direction.
- Commodities where corrective moves regularly respect Fibonacci retracement levels.
- Index markets during sustained bullish or bearish trends.
- Cryptocurrency markets, where strong momentum is often followed by deep retracements.
- Any actively traded instrument with clear swing highs and swing lows.
Trading Styles
- Swing trading.
- Scalping.
- Day trading.
- Trend-following strategies.
- Pullback trading.
How traders use it
Many Forex traders wait for price to retrace toward important Fibonacci levels such as 38.2%, 50%, or 61.8% before looking for confirmation to enter in the direction of the prevailing trend.
Others use the retracement levels to manage open positions by placing stop-loss orders beyond key Fibonacci zones or setting profit targets near previous highs and lows.
When several technical signals align around the same Fibonacci level, the area often attracts additional market attention.
Get Instant Free Access
Indicator Settings
- Fibo Mode – Switch between Automatic mode or manually selecting the Fibonacci anchor points.
- Fibo Levels Color – Changes the color of the Fibonacci retracement lines.
- Fibo Levels Width – Adjusts the thickness of the Fibonacci level lines for improved visibility.
- Fibo Levels Style – Selects the line style, including solid or dotted lines.
Important Notes
- Automatic Fibonacci levels update whenever new swing highs or lows are established.
- The indicator performs best when markets are trending rather than moving sideways.
- Fibonacci levels should be confirmed with price action before opening a trade.
- The 38.2%, 50%, and 61.8% retracement levels often receive the most attention from traders.
- Higher timeframe Fibonacci levels generally carry greater technical significance than those on lower timeframes.









