
The XMASTER Formula indicator for MT5 is a trend analysis tool that combines Moving Average calculations with MACD-based momentum analysis to identify the current market direction.
By combining trend strength and momentum information, the indicator helps traders recognize possible buying and selling opportunities through easy-to-read green and red arrows.
The indicator is designed to simplify trend identification by filtering market movement and highlighting periods where momentum supports a directional move.
For traders who prefer trend-following strategies, the XMASTER Formula Indicator can provide valuable confirmation before entering a position.
Why traders use the XMASTER Formula Indicator
Many traders struggle with identifying whether a market move has enough strength to continue or whether it is only a temporary price fluctuation.
The XMASTER Formula Indicator addresses this challenge by combining two popular technical concepts: moving averages for trend direction and MACD for momentum evaluation.
The simple line signals allow traders to quickly recognize possible trend changes, while the underlying calculations help filter weaker market movements.
Although the default settings can be used, many traders find that increasing the XMASTER period to 200 creates a smoother and more reliable trend filter.
This longer setting reduces unnecessary signals and focuses more on stronger market movements.
Download This MT5 Indicator for Free
Indicator Chart Setup
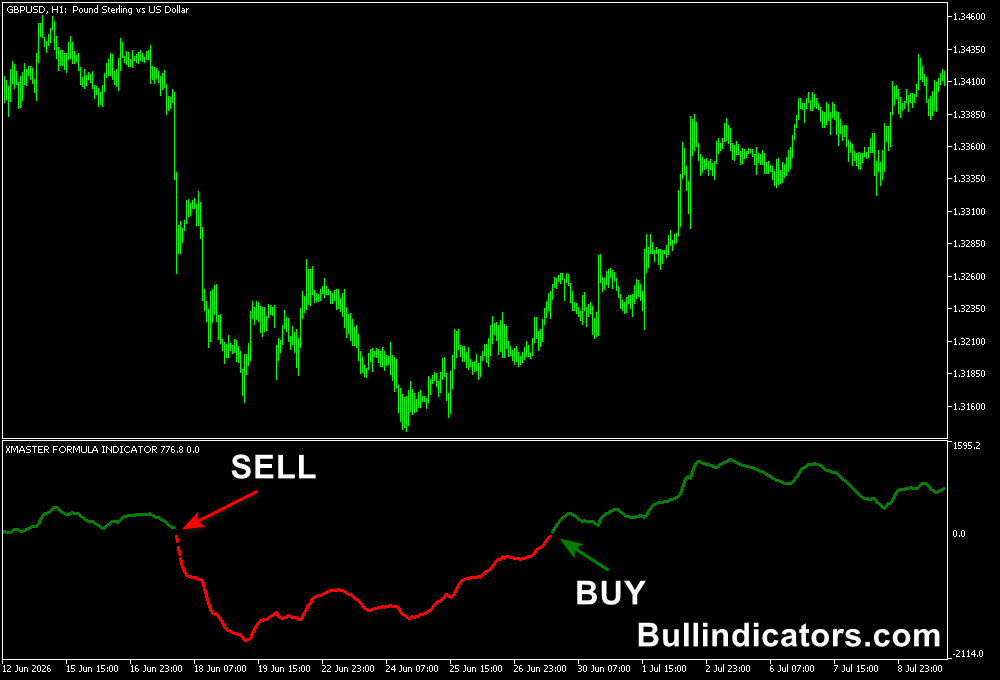
After attaching the indicator, green and red lines appear on the chart to represent potential bullish and bearish conditions.
Green lines indicate possible upward momentum, while red lines highlight potential downward pressure.
The indicator analyzes the relationship between trend direction and momentum to determine when market conditions may favor buyers or sellers.
The XMASTER Formula Indicator can be applied to different timeframes, making it suitable for traders who use short-term setups as well as longer trend-following approaches.
Core Features
- Combines Moving Average and MACD calculations.
- Displays visual buy and sell lines.
- Identifies market trend direction and strength.
- Helps filter weaker price movements.
- Suitable for multiple trading strategies.
- Customizable calculation period.
Best for
- Trend identification.
- Momentum confirmation.
- Following established market movements.
- Filtering entry opportunities.
- Building trend-based trading systems.
Best Markets
- Currency pairs that develop strong directional trends during active trading sessions.
- Gold and commodities where momentum phases can create extended price movements.
- Stock indices that often follow clear bullish and bearish cycles.
- Cryptocurrency markets during strong expansion phases.
- Any liquid market where trend strength plays an important role.
Trading Styles
- Scalping on M1 and M5 charts.
- Intraday trading on M15 charts.
- Swing trading on H1 charts.
- Trend following strategies.
- Momentum trading for rapid entry.
How traders use it
Traders generally use the XMASTER Formula Indicator by following the direction of the generated arrows.
A green line can be used as a signal to look for buying opportunities, while a red signal line can indicate potential selling conditions.
Users prefer waiting for additional confirmation, such as price remaining above or below a major moving average or breaking an important support or resistance level.
For improved reliability, traders often adjust the XMASTER period setting from its default value to 200.
This longer period creates a slower trend filter, reducing frequent signal changes and helping traders focus on stronger market trends rather than short-term fluctuations.
Get Instant Free Access
Indicator Settings
- XMASTER Period – Controls the calculation period used by the indicator. Increasing this value to 200 can provide a smoother and more reliable trend filter.
- Moving Average Settings – Adjusts the trend calculation component used by the indicator.
- MACD Settings – Controls the momentum calculation used for identifying market strength.
- Arrow Display Options – Allows traders to customize the appearance of entry signals.
Important Notes
- The XMASTER Formula Indicator works best when used in trending market conditions.
- The default period may produce more signals, while a 200-period setting can help reduce market noise.
- Arrow signals should be confirmed with price action or additional technical analysis.
- The indicator is designed to identify trend direction and does not predict future price movement.
- Higher timeframe signals generally provide stronger trend information.









