
The Support Resistance Breakout Arrows indicator for MT5 is a technical trading tool designed to identify breakout opportunities while automatically marking important support and resistance areas.
The indicator combines fractal analysis with CCI and RSI filtering to generate directional signals through colored arrows.
By displaying potential breakout points together with key price zones, traders can quickly evaluate whether the market is preparing for a continuation move or a possible reversal.
Why traders use the Support Resistance Breakout Arrows Indicator
Breakout trading requires accurate identification of levels where price may accelerate after consolidation.
Manually drawing support and resistance can be time-consuming and often depends on individual interpretation.
This indicator simplifies the process by automatically locating relevant price zones and highlighting possible breakout entries.
The combination of momentum filters and price levels makes the indicator useful for traders who want additional confirmation before entering a position.
The arrows help identify potential buy and sell opportunities, while the support and resistance zones provide important areas for planning entries, exits, and additional positions during strong trends.
Download This MT5 Indicator for Free
Indicator Chart Setup
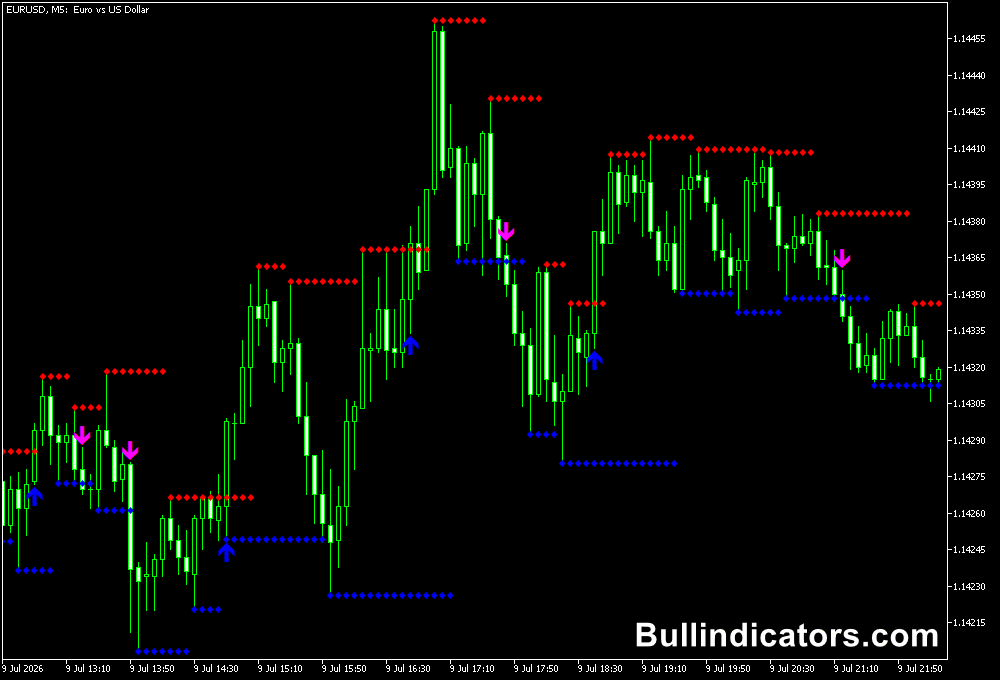
After applying the indicator, support and resistance areas are displayed directly on the chart together with breakout arrows.
Blue arrows represent potential bullish opportunities, while magenta arrows indicate possible bearish setups.
Support zones are highlighted in blue and resistance areas appear in red, allowing traders to quickly recognize important market levels.
The indicator can be used on different timeframes, but it is especially popular among intraday traders who focus on H1 and lower timeframes.
Higher timeframe traders can also apply it for broader market analysis.
Core Features
- Automatically detects support and resistance levels.
- Generates buy and sell breakout arrows.
- Uses RSI and CCI filters to improve signal quality.
- Based on fractal price analysis.
- Provides non-repainting signals and levels.
- Suitable for multiple trading timeframes.
Best for
- Breakout trading strategies.
- Intraday market analysis.
- Support and resistance trading.
- Trend continuation setups.
- Multi-timeframe technical analysis.
Best Markets
- Forex pairs with strong session-based movements where breakouts frequently occur.
- Gold and silver, where important price zones often trigger sharp directional moves.
- Major indices that regularly form consolidation areas before expansion phases.
- Volatile currency crosses that create strong momentum after level breaks.
- Markets with clear swing highs and lows suitable for fractal-based analysis.
Trading Styles
- Scalping.
- Intraday trading.
- Breakout trading.
- Trend following.
- Swing trading.
How traders use it
Traders typically wait for an arrow signal to appear near a confirmed support or resistance breakout area.
A blue arrow can indicate a possible buying opportunity after price breaks above resistance, while a magenta arrow can highlight a potential sell setup after price moves below support.
Another approach is using the automatically drawn levels as part of a trend strategy.
During a strong uptrend, traders may use support zones as possible areas to add positions.
During bearish conditions, resistance zones can help identify areas where selling pressure may return.
Combining the signals with price action patterns can provide additional confirmation.
Get Instant Free Access
Download Support Resistance Breakout Arrows Indicator.ex5 for MT5
Indicator Settings
- RSI CCI_Filter – Enables filtering of signals using RSI and CCI conditions.
- RSI Period – Sets the calculation period for the RSI indicator.
- RSI Overbought – Defines the RSI overbought level used for filtering signals.
- RSI Oversold – Defines the RSI oversold level used for filtering signals.
- CCI Period – Sets the calculation period for the CCI indicator.
- CCI BuyLevel – Determines the CCI level required for buy conditions.
- CCI SellLevel – Determines the CCI level required for sell conditions.
- HighLow – Enables alerts when important highs or lows are broken.
- SignalDots – Sets the number of confirmation dots required for a signal.
- Alerts – Turns indicator alerts on or off.
Important Notes
- Breakout signals are stronger when they occur with increased market momentum.
- Support and resistance zones can be used together with the arrows for better trade planning.
- False breakouts can still occur during low-volume or sideways market conditions.
- Higher timeframe levels generally have more importance than short-term levels.
- The indicator works best when combined with a complete trading strategy and proper market analysis.









