
The Supertrend indicator for MT5 is a popular trend-following tool designed to identify market direction, trend reversals, and potential trade opportunities with minimal chart noise.
Unlike many trend indicators that constantly fluctuate with every candle, the Supertrend focuses on meaningful price movement and volatility, allowing traders to stay aligned with the dominant market direction.
This non-repaint version plots a single dynamic trend line directly on the chart.
The indicator changes color when market conditions shift, making it easy to recognize bullish and bearish phases at a glance.
It is particularly effective for intraday traders who need a clear visual framework for trend identification, trade management, and stop-loss placement.
Because the indicator incorporates both price action and volatility, it adapts to changing market conditions while filtering out many minor fluctuations that often generate false signals.
Why traders use the Supertrend Indicator
Professional traders value the Supertrend because it simplifies trend analysis without sacrificing accuracy.
The indicator automatically adjusts to market volatility and provides clear trend direction through its color-changing line.
During bullish conditions, the line acts as dynamic support, while during bearish conditions it serves as dynamic resistance.
Another advantage is its ability to identify trend continuation and trend reversal conditions using a single chart overlay.
Many traders also use the Supertrend as a trailing stop mechanism, helping them remain in profitable trades while protecting accumulated gains.
The indicator performs exceptionally well during strong trending markets and can be combined with price action analysis, market structure concepts, moving averages, or momentum indicators to improve trade selection.
Download This MT5 Indicator for Free
Indicator Chart Setup
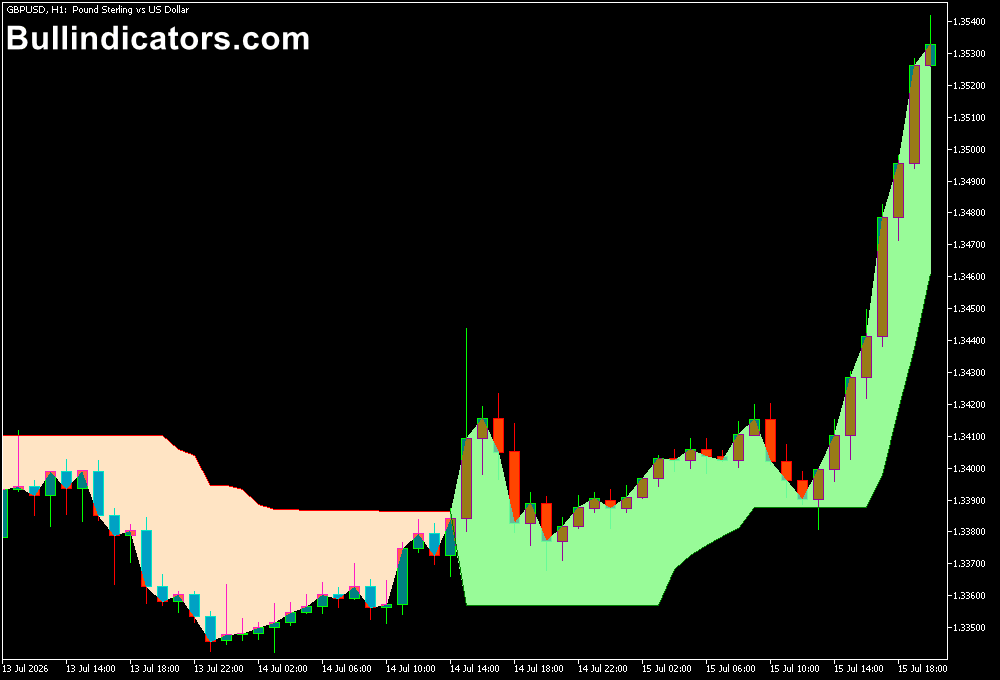
When applied to a MetaTrader 5 chart, the Supertrend Indicator displays a single trend line that follows price movement.
The line turns green when bullish conditions dominate and turns red when bearish momentum takes control.
When price remains above the Supertrend level, the market is considered to be in an uptrend.
In this situation, the line often acts as support during pullbacks.
When price falls below the indicator, the trend shifts bearish and the line becomes a resistance level.
One unique characteristic of the Supertrend is that it does not react to every candle close.
During consolidation phases and inside-bar formations, the line may remain unchanged.
This behavior helps traders identify sideways market conditions and avoid unnecessary trades during periods of low directional momentum.
Core Features
- Non-repaint trend indicator
- Automatic trend reversal detection
- Color-coded bullish and bearish signals
- Dynamic support and resistance levels
- Built-in volatility adjustment
- Suitable for stop-loss and trailing-stop management
- Works across all MT5 timeframes
Best for
- Trend-following strategies
- Intraday trading
- Trend reversal detection
- Trade management
- Breakout trading setups
- Trailing stop placement
Best Markets
- EUR/USD
- GBP/USD
- USD/JPY
- XAU/USD (Gold)
- US indices
- European indices
- Individual stocks
- Cryptocurrency CFDs
Trading Styles
- Scalping on M1, M5 and M15 charts
- Day trading
- Swing trading
- Trend trading
How traders use it
Many traders wait for price to close above the Supertrend line before considering long positions.
Once the trend line turns green, they look for pullbacks, bullish candlestick patterns, or breakout opportunities that align with the prevailing trend.
For short trades, traders monitor situations where price closes below the Supertrend level and the indicator switches to brown.
This confirms bearish market conditions and allows traders to focus on selling opportunities during retracements or downside breakouts.
Another common approach is to use the Supertrend as a trade management tool.
As the trend develops, the indicator line can serve as a trailing stop level.
The position remains active until price closes beyond the trend line, signaling a possible trend reversal or weakening momentum.
When the Supertrend remains flat for multiple candles, many traders interpret this as a consolidation phase.
Rather than forcing trades during low-volatility conditions, they wait for a decisive breakout before entering the market.
Get Instant Free Access
Indicator Settings
- Supertrend Period: Controls the amount of historical price data used in the calculation. Lower values generate more frequent trend changes and earlier signals. Higher values create smoother trend lines that focus on larger market movements while filtering short-term fluctuations.
- Multiplier: Adjusts the distance between the Supertrend line and current price. Smaller multiplier values place the line closer to price action, producing faster signals. Larger multiplier values move the line further away, reducing signal frequency and filtering weaker market movements.
Important Notes
- The indicator performs best during trending market conditions.
- Strong breakout signals often occur after periods of consolidation.
- Higher period settings generally produce fewer but more stable trend signals.
- The Supertrend line can be used for both initial stop-loss placement and trade management.
- Combining the indicator with price action confirmation can improve trade quality.
- Always consider overall market structure before entering a position.
- Risk management remains essential regardless of signal quality.









