
The Target Bands indicator for MetaTrader 5 is a channel-based trend trading tool designed to identify potential market reversal zones.
The indicator creates upper and lower bands around price action, highlighting areas where the market may become overextended.
When price reaches these extreme zones, traders can look for signs of exhaustion and possible trend reversals.
Unlike traditional channels that mainly follow price direction, Target Bands focus on identifying areas where price movement may slow down or reverse.
The indicator uses historical price behavior to calculate dynamic zones and also displays signal markers when potential trading opportunities appear.
The Target Bands Indicator is suitable for scalping, intraday trading, and short-term reversal strategies.
For better results, many traders combine it with price action analysis or additional confirmation indicators to filter weaker signals.
Why Traders Use the Target Bands Indicator
Markets frequently move between periods of expansion and correction.
When price stretches too far away from its average movement, a retracement often follows.
Target Bands help traders visualize these extreme areas and prepare for possible turning points.
The upper band can act as a potential resistance zone, while the lower band can highlight possible support areas.
When price breaks beyond these levels, traders can monitor the market for reversal patterns or continuation signals depending on the overall trend.
Download This MT5 Indicator for Free
Indicator Chart Setup
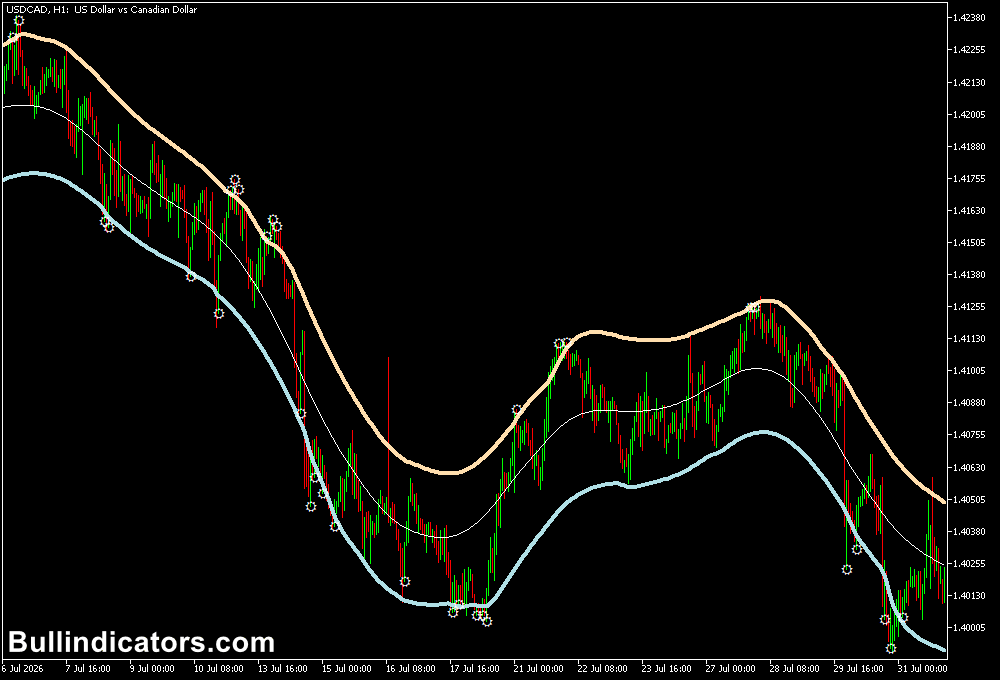
The indicator displays two dynamic bands around the price chart.
These levels adjust according to market volatility and recent price behavior.
A star signal appears above or below candles when the indicator detects a possible selling or buying opportunity.
When price moves outside the bands, traders often watch for confirmation through candlestick patterns, momentum indicators, or trend analysis before entering a position.
Core Features
- Displays dynamic upper and lower price bands.
- Identifies possible overbought and oversold areas.
- Provides buy and sell signal markers.
- Useful for reversal and pullback strategies.
- Adjusts to different market conditions.
- Suitable for forex, indices, commodities, and other markets.
Best for
- Spotting potential market reversals.
- Trading price exhaustion zones.
- Finding pullback opportunities.
- Short-term scalping setups.
- Combining technical signals with candlestick confirmation.
Best Markets
- EURUSD for smoother reversal setups during active sessions.
- GBPJPY where large price swings create strong exhaustion zones.
- EURJPY for intraday pullback opportunities.
- GBPUSD during London session volatility.
- XAUUSD (Gold) for short-term reversal movements.
- US30 and NAS100 when markets move aggressively away from average prices.
Trading Styles
- Scalping on M1 and M5 charts.
- Intraday reversal trading on M15 and H1.
- Short-term swing trading using H4 confirmation.
- Counter-trend setups after extreme price movements.
- Price action trading combined with technical confirmation.
How Traders Use It
The Target Bands Indicator works best when combined with confirmation rather than trading every signal immediately.
A common approach is waiting for price to reach an outer band and then looking for evidence that momentum is weakening.
For example, when price moves below the lower band and the indicator prints a buy signal, traders can wait for a bullish candlestick pattern before entering.
A similar approach can be used for sell trades when price reaches the upper band.
Simple Strategy: Target Bands + RSI Divergence Indicator
Combining Target Bands with the RSI Divergence Indicator for MT5 can help identify stronger reversal opportunities.
Target Bands highlights extreme price locations, while RSI divergence confirms whether momentum is weakening.
BUY Setup
- Wait for price to touch or move below the lower Target Bands zone.
- Look for a bullish signal from the Target Bands Indicator.
- Confirm that RSI is showing bullish divergence, where price makes a lower low but RSI creates a higher low.
- Enter a BUY trade after a bullish candlestick confirmation.
- Place the stop loss below the recent swing low.
- Target the middle band, opposite band, or the next resistance level.
SELL Setup
- Wait for price to touch or move above the upper Target Bands zone.
- Look for a bearish signal from the Target Bands Indicator.
- Confirm RSI bearish divergence, where price creates a higher high while RSI forms a lower high.
- Enter a SELL trade after a bearish candlestick confirmation.
- Place the stop loss above the recent swing high.
- Target the middle band, opposite band, or the next support level.
Get Instant Free Access
Indicator Settings
- Timeframe: Defines the timeframe used for analysis.
- Half Length: Sets the number of historical bars used for trend calculations.
- Price: Determines the price source used for signal calculations.
- Bands Deviation: Controls the distance of the bands from price.
- Interpolate: Enables or disables automatic adjustment across multiple timeframes.
- Alerts On: Activates or disables signal notifications.
Important Notes
- The indicator should not be used alone during strong trending markets.
- Extreme band readings can remain active during powerful price movements.
- Confirmation from price action or additional indicators can improve accuracy.
- Higher timeframes generally provide stronger reversal zones.
- Adjust the settings according to the volatility of each market.
- Always use proper risk management when trading reversal setups.









