
The Hull Average 2 indicator for MT5 is a trend-following tool designed to identify market direction and possible trend reversals with a smooth visual approach.
Based on the Hull Moving Average (HMA), it reduces the lag commonly found in traditional moving averages by giving more importance to recent price movements.
Rather than displaying traditional crossover signals, Hull Average 2 uses a simple color-changing slope to show the current market condition.
The green slope indicates bullish momentum, while the red slope highlights bearish pressure.
This makes it easy to follow trends across different timeframes without complicated calculations.
The tool is suitable for intraday Forex analysis, but it can also be integrated into broader trading systems.
Combining the overall trend direction from Hull Average 2 with a faster entry tool can help create a complete trend and scalping approach.
Why traders use Hull Average 2 Indicator
Many traders use Hull Average 2 because it provides a cleaner way to identify trend changes compared to standard moving averages.
The smooth calculation helps remove some market noise while still reacting quickly when price momentum changes.
The color-based display makes the trend direction immediately visible.
A green slope suggests buyers are controlling the market, while a red slope indicates increasing selling pressure.
This simple presentation makes the tool suitable for beginners while still offering value for experienced traders who already use moving average strategies.
Another advantage is flexibility.
The calculation period, method, and price settings can be adjusted to create faster signals for scalping or slower signals for swing trading.
Download This MT5 Indicator for Free
Indicator Chart Setup
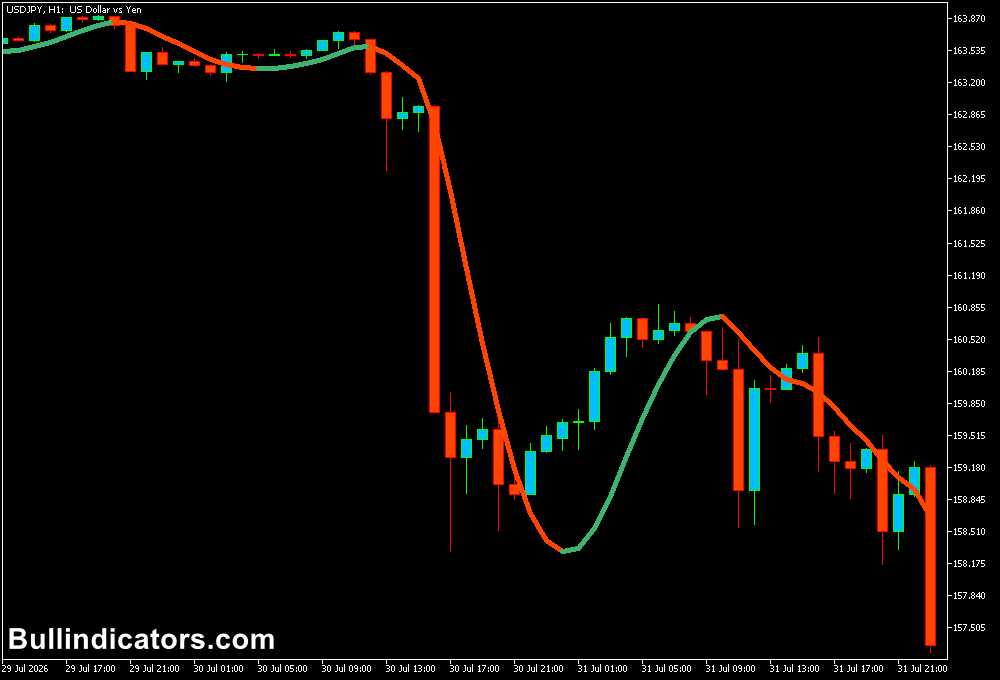
The Hull Average 2 Indicator displays a single colored moving average slope directly on the MetaTrader 5 price chart.
The slope changes color according to the current trend condition, allowing traders to quickly recognize bullish and bearish phases.
A green Hull line represents a bullish trend environment, while a red line signals bearish momentum.
The moment the color changes can be viewed as a possible transition point where market direction is changing.
Core Features
- Based on the Hull Moving Average calculation.
- Reduces moving average lag compared to traditional methods.
- Uses color changes to display trend direction.
- Focuses on recent price movements.
- Suitable for intraday and swing trading.
- Customizable calculation settings.
Best for
- Identifying overall market direction.
- Following momentum-based trends.
- Filtering trades against the main trend.
- Creating trend confirmation systems.
- Combining with faster entry and exit tools.
Best Markets
- Major FX Pairs: Effective for following clean directional movements during London and New York sessions.
- XAU/USD: Helps track powerful gold momentum moves.
- NASDAQ and major indices: Can highlight extended directional price movements.
- Cryptocurrency markets: Suitable for markets with strong volatility and trend expansion.
Trading Styles
- Trend following: Stay aligned with the dominant market direction.
- Scalping: Combine with faster tools on M1 and M5 charts.
- Intraday trading: Use M15 and H1 charts for session-based setups.
- Swing trading: Apply H4 and D1 charts for larger market trends.
How traders use it
The basic Hull Average 2 strategy is based on following the color change of the moving average slope.
A bullish setup appears when the line changes from red to green, showing that buying momentum is increasing.
A bearish setup develops when the line changes from green to red, indicating possible downward movement.
For stronger confirmation, traders often wait for price action to support the signal.
A buy opportunity is generally considered when the Hull line turns green and price reacts from a support area or a previous swing low.
A sell opportunity is considered when the Hull line turns red while price rejects resistance or forms bearish price action.
Scalping Strategy: Hull Average 2 Indicator + FX Sniper Scalper
A powerful way to use Hull Average 2 is by combining it with the FX Sniper Scalper Indicator for MT5.
In this approach, Hull Average 2 defines the overall market trend, while FX Sniper Scalper provides precise entry and exit points for short-term trades.
The Hull Average 2 acts as the trend filter:
- Green Hull line = Only look for buy scalping opportunities.
- Red Hull line = Only look for sell scalping opportunities.
The FX Sniper Scalper is then used for timing entries:
- Green FX Sniper line = Buy scalp entry.
- Red FX Sniper line = Sell scalp entry.
Buy Scalping Rules
- Wait until Hull Average 2 turns green to confirm the bullish trend.
- Move to a lower timeframe such as M1 or M5.
- Wait for the FX Sniper Scalper line to turn green.
- Open a buy trade when the green entry signal appears.
- Place a stop loss below the recent swing low.
- Exit when FX Sniper changes red or when a profit target is reached.
Sell Scalping Rules
- Confirm that Hull Average 2 is red and the overall trend is bearish.
- Wait for a short-term setup on M1 or M5.
- Enter a sell trade when FX Sniper Scalper changes to red.
- Place a stop loss above the latest swing high.
- Close the trade when FX Sniper turns green or price reaches the target.
Trade Example
Imagine GBP/USD trading on the M5 chart.
The Hull Average 2 indicator changes from red to green after price breaks above a previous resistance area.
This signals that the short-term trend has turned bullish.
Instead of entering immediately, the trader waits for the FX Sniper Scalper to provide a green entry signal.
When the green line appears, a buy scalp trade is opened with a stop loss below the latest pullback low.
The position remains active while both tools support the bullish move.
When FX Sniper Scalper changes back to red, the trader closes the position and waits for the next opportunity.
Get Instant Free Access
Indicator Settings
- Period – Controls the number of candles used to calculate the Hull Moving Average value.
- Method – Adjusts the signal frequency by changing the moving average calculation method.
- Price – Determines the price source used for the Hull calculation and affects the distance between price and the slope.
Important Notes
- Hull Average 2 should not be used as the only confirmation tool in every market condition.
- Fast settings may generate more signals but can also increase false entries.
- Higher periods create smoother trends with fewer signals.
- Combining trend direction with support, resistance, and price action can improve results.
- Always test the settings on historical data and a demo account before live trading.









