
The Supply Demand indicator for MT5 automatically identifies high-probability supply and demand zones directly on your MetaTrader 5 charts.
These areas represent price levels where significant buying or selling activity previously entered the market, making them valuable reference points for future trading decisions.
Supply and demand trading remains one of the most respected price action techniques because institutional order flow often leaves visible footprints on the chart.
When price revisits these levels, the market frequently reacts with strong reversals, temporary pullbacks, or breakout opportunities.
This indicator simplifies the entire process by highlighting both established and developing zones, allowing traders to focus on trade planning instead of chart analysis.
Why traders use the Supply Demand Indicator
Support and resistance levels are useful, but supply and demand zones provide a broader view of where aggressive buying and selling previously occurred.
Unlike a single horizontal line, these zones represent an entire price area where large market participants may have entered positions.
The indicator distinguishes between confirmed zones that have already proven their strength and untested areas that deserve additional attention.
This allows Forex traders to prioritize stronger levels while monitoring developing opportunities.
Many traders also use these zones to improve trade entries, position stop losses more effectively, and identify realistic profit targets before entering a position.
Download This MT5 Indicator for Free
Indicator Chart Setup
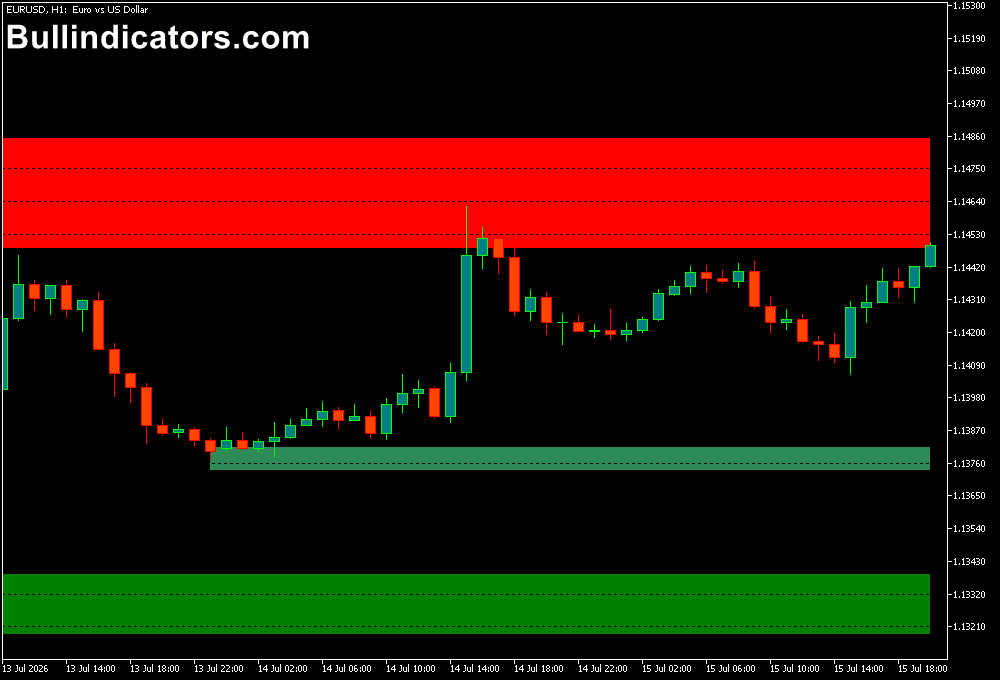
After attaching the indicator to an MT5 chart, colored supply and demand zones appear automatically across the chart.
Strong confirmed zones are displayed differently from untested areas, allowing traders to quickly distinguish between price levels that have already reacted and those that may still produce their first significant market response.
Optional Fibonacci retracement levels can also be displayed between selected zones for additional confluence during trade analysis.
Core Features
- Automatic supply and demand zone detection
- Displays confirmed, weak, broken, and untested zones
- Optional Fibonacci retracement overlay
- Dynamic zone calculations using ATR
- Supports multiple markets and timeframes
- Customizable colors and alert options
Best for
- Support and resistance trading
- Institutional order flow analysis
- Reversal trading strategies
- Breakout and retest setups
- Planning entry, stop loss, and profit target levels
Best Markets
- Major Forex pairs
- Cross currency pairs
- Gold and silver
- Stock indices
- Oil and energy markets
- Cryptocurrency CFDs
Trading Styles
- Price action trading
- Swing trading using institutional zones
- Day trading around session highs and lows
- Breakout confirmation trading
- Trend continuation after pullbacks
- Multi-timeframe analysis using higher timeframe zones
How traders use it
Most traders begin by identifying the strongest confirmed supply and demand zones on higher timeframes before refining their entries on lower charts.
A long setup typically develops when price returns to a confirmed demand zone and buyers show renewed strength through bullish candlestick patterns or momentum confirmation.
For short positions, traders wait for price to revisit an established supply zone where selling pressure previously entered the market.
If bearish price action develops inside the zone, they often enter with a protective stop placed above the supply area.
Untested zones are frequently monitored as potential future reaction levels, while broken zones may indicate changing market sentiment and possible trend continuation.
Get Instant Free Access
Indicator Settings
- Show Weak Zones: Displays weaker supply and demand zones that have produced a smaller market reaction.
- Show Untested Zones: Shows newly formed zones that price has not yet revisited since their creation.
- Show Broken Zones: Displays zones that have already been broken by price and may no longer act as reliable support or resistance.
- Zone ATR Factor: Adjusts how the indicator calculates the depth and size of each zone using the Average True Range.
- ZoneStrength: Internal calculation parameter used by the indicator. It has little visible impact on the chart under normal conditions.
- NoWeakZones: Enables or removes weak zones from the chart to keep the display focused on stronger areas.
- DrawEdgePrice: Displays the exact price level along the edge of each supply and demand zone.
- ZoneWidth: Internal zone width setting with minimal visible effect on the chart layout.
- ZoneFibs: Displays a Fibonacci retracement between selected zones when enabled together with the HUD option.
- Colors: Customize the appearance of each zone type to match your preferred chart template.
- Alerts: Receive notifications whenever price interacts with important supply or demand zones.
Important Notes
- Confirmed zones that have reacted multiple times generally carry more significance than newly created zones.
- Higher timeframe supply and demand levels often produce stronger market reactions.
- Use candlestick confirmation before entering trades inside a zone.
- Broken zones can provide valuable information about changing market structure.
- Combining supply and demand analysis with trend direction often improves trade selection.









