
The RSI Divergence oscillator indicator for MT5 combines the well-known Relative Strength Index with automatic divergence detection to highlight potential trend reversals.
Divergence develops when price and momentum move in opposite directions, often indicating that the current trend is weakening before a reversal or deeper correction occurs.
The indicator continuously compares price action with RSI momentum and marks bullish and bearish divergence patterns directly on the chart.
This removes the need to manually compare swing highs and swing lows, making it much easier to spot opportunities as they develop.
It is suitable for Forex, commodities, indices, and other markets supported by MetaTrader 5.
Why traders use the RSI Divergence Indicator
Momentum frequently changes before price fully reverses.
Divergence is one of the earliest technical clues that buying or selling pressure is beginning to fade.
When price records a new high while the RSI fails to do the same, buying momentum is slowing.
The opposite applies during bearish trends, where improving RSI momentum may signal that sellers are losing control.
The indicator automatically identifies these conditions and presents them in an easy-to-read format.
It is particularly effective after strong trends, near important support or resistance levels, and during pullbacks where continuation or reversal decisions become critical.
Download This MT5 Indicator for Free
Indicator Chart Setup
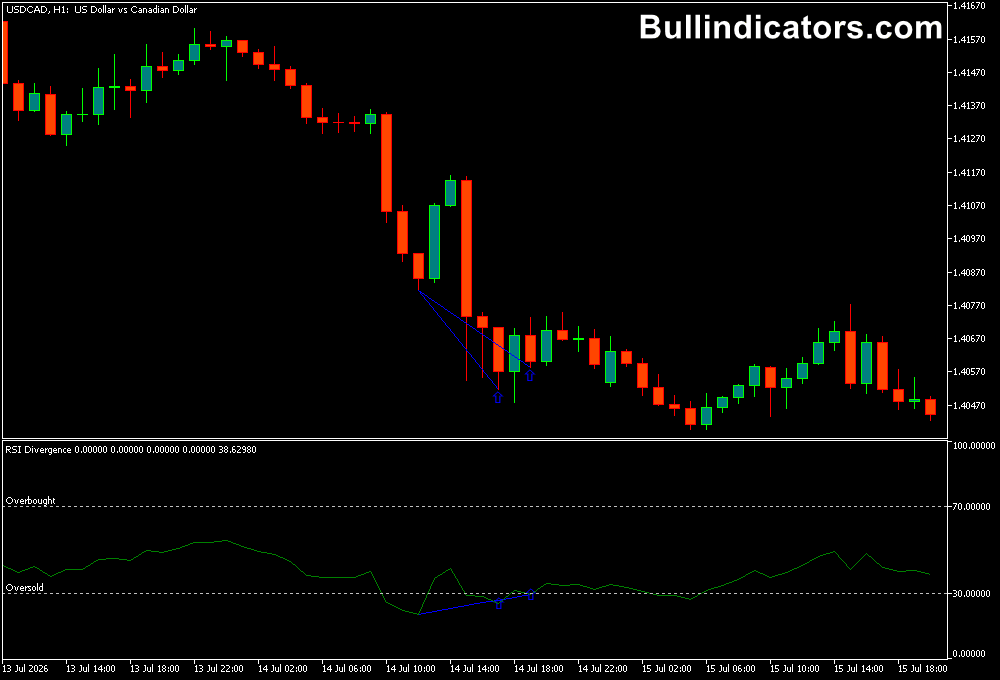
Once added to an MT5 chart, the indicator displays the Relative Strength Index together with automatically detected divergence signals.
Bullish divergences appear when price forms lower lows while the RSI creates higher lows.
Bearish divergences appear when price reaches higher highs but the RSI forms lower highs.
The overbought and oversold levels provide additional confirmation when evaluating each signal.
Core Features
- Automatic bullish and bearish divergence detection
- Built-in Relative Strength Index analysis
- Highlights momentum exhaustion
- Works across all MT5 timeframes
- Customizable RSI calculation settings
- Simple visual signals for potential reversals
Best for
- Reversal trading
- Momentum analysis
- Trend exhaustion detection
- Swing trading
- Entry confirmation after pullbacks
Best Markets
- Major Forex pairs
- Cross currency pairs
- Gold and silver
- Stock indices
- Individual shares
- Cryptocurrency CFDs
Trading Styles
- Swing trading using momentum shifts
- Countertrend opportunities with confirmation
- Intraday trading during trend exhaustion
- Higher timeframe reversal analysis
- Price action strategies combined with oscillators
- Multi-timeframe technical analysis
How traders use it
A bullish setup develops when price records a lower low while the RSI forms a higher low, showing that bearish momentum is fading.
Many market participants wait for a bullish confirmation candle before opening a long position.
The protective stop is commonly placed below the most recent swing low, while profit targets are based on nearby resistance levels or changes in momentum.
A bearish opportunity appears when price reaches a higher high but the RSI produces a lower high.
This loss of momentum can signal that buyers are losing strength.
Additional confirmation from chart patterns, moving averages, or resistance levels often increases the quality of the setup before entering a short position.
Get Instant Free Access
Indicator Settings
- RSI Period: Defines the number of candles used to calculate the Relative Strength Index. Smaller values create a faster RSI with more signals, while larger values produce smoother momentum readings.
- Applied Price: Selects which price is used for the RSI calculation, including Close, Open, High, Low, Median Price, Typical Price, and other available price types.
- Overbought: Sets the upper RSI level where the market may be considered overextended. The default value is commonly 70.
- Oversold: Sets the lower RSI level where the market may be considered oversold. The default value is commonly 30.
- Colors: Customize the appearance of the RSI line, divergence signals, and chart objects.
Important Notes
- Divergence signals become more reliable when they develop near major support or resistance.
- Higher timeframe divergences generally carry greater significance than lower timeframe signals.
- Strong trends can continue even after divergence appears, so confirmation remains important.
- Risk management should always accompany every trade setup.
- The indicator performs best when combined with price action and overall market structure.









