
The QQE Indicator for MT5 (Qualitative Quantitative Estimation) is an advanced momentum and trend analysis tool based on a modified RSI calculation.
By applying smoothing techniques to the traditional Relative Strength Index, the indicator provides a cleaner view of market momentum while reducing unnecessary market noise.
QQE is designed to identify trend direction, momentum shifts, and possible reversal points.
The indicator displays a smoothed RSI line together with a trailing line, allowing traders to monitor crossovers, divergence formations, and changes in buying or selling pressure.
It is suitable for different trading approaches, from intraday momentum setups to longer-term trend analysis.
Why traders use the QQE Indicator
The standard RSI is widely used, but rapid market fluctuations can sometimes create inconsistent signals.
The QQE Indicator improves RSI analysis by smoothing momentum changes and presenting a clearer picture of market strength.
This makes it easier to identify when buyers or sellers are gaining control.
Traders often use QQE as a confirmation tool alongside their existing strategy.
For example, combining QQE with a 200 EMA can help define the overall market direction.
When price is trading above the 200 EMA and QQE confirms positive momentum, traders can focus on long setups.
When price remains below the 200 EMA and QQE turns negative, short opportunities become more relevant.
Download This MT5 Indicator for Free
Indicator Chart Setup
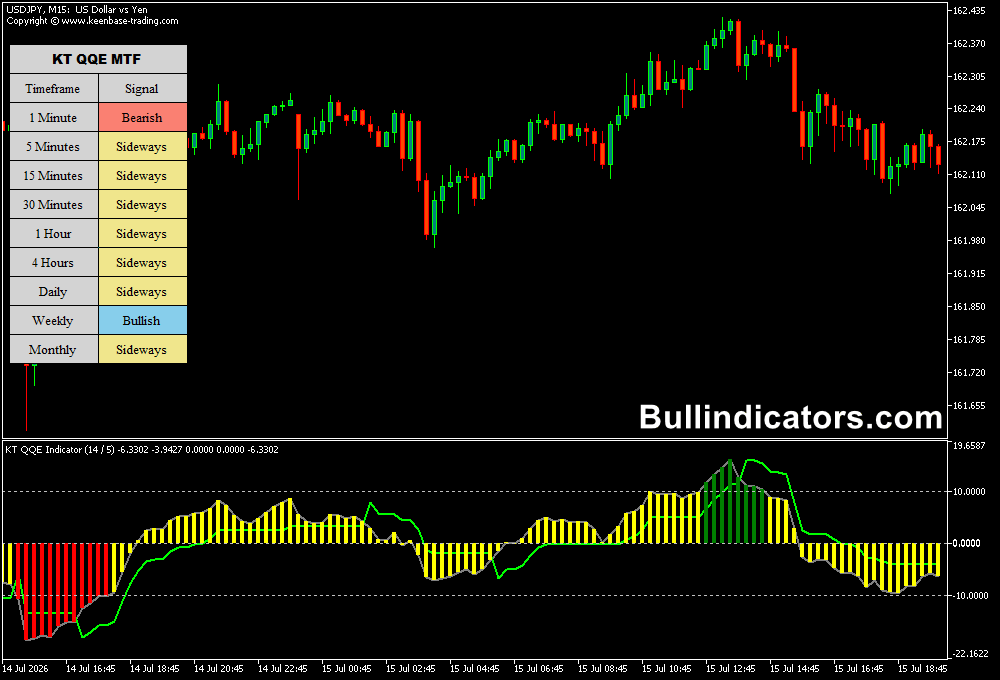
After attaching the QQE Indicator to an MT5 chart, traders will see a smoothed RSI line and a slower trailing line in the indicator window.
Crossovers between these two lines highlight momentum changes.
Positive crossovers indicate increasing buying pressure, while negative crossovers suggest that sellers are becoming stronger.
The indicator also includes level areas that help identify strong momentum conditions.
When QQE moves into higher positive values, the market may be experiencing strong bullish momentum.
Negative readings can indicate increasing bearish pressure.
Core Features
- Enhanced RSI-based momentum calculation
- Smoothed RSI signals with reduced market noise
- Bullish and bearish crossover detection
- Momentum reversal identification
- Divergence analysis capabilities
- Multi-timeframe scanning option
Best for
- Trend confirmation
- Momentum analysis
- Reversal identification
- Trade entry filtering
- Divergence-based strategies
Best Markets
- EUR/USD, GBP/USD, and USD/JPY
- Volatile pairs such as GBP/JPY
- Gold (XAU/USD)
- US indices including NAS100 and US30
- Commodity CFDs
- Major cryptocurrency pairs
Trading Styles
- Trend following strategies
- Momentum trading
- Intraday signal confirmation
- Swing trading with higher timeframe filters
- Multi-timeframe market analysis
- Pullback trading within established trends
How traders use it
A common approach is to use QQE as a trend confirmation indicator.
When the QQE line crosses above the trailing line, it suggests increasing bullish momentum.
Traders may look for buying opportunities, especially when price is positioned above a major moving average such as the 200 EMA.
For example, if EUR/USD is trading above the 200 EMA on the H1 chart, the market is considered to have a bullish bias.
When QQE produces a bullish crossover after a temporary pullback, traders can use this as confirmation that upward momentum is returning.
A stop loss can be placed below the recent swing low, while targets are based on nearby resistance areas.
Bearish setups follow the opposite logic.
When price trades below the 200 EMA and QQE crosses downward, traders can focus on short opportunities.
Divergence between price and QQE can also provide early warnings that a trend may be losing strength.
Get Instant Free Access
Indicator Settings
- RSI Period: Defines the number of candles used to calculate the Relative Strength Index. A lower value makes the indicator respond faster to price changes, while a higher value creates smoother momentum readings.
- Smooth Period: Controls the smoothing applied to the RSI calculation. The default setting is 5. Lower values create more frequent signals, while higher values reduce signal frequency and provide a smoother interpretation of momentum.
- MTF Scanner: Enables multi-timeframe scanning, allowing traders to monitor QQE conditions across different chart periods.
- Alerts: Includes optional push notifications, email alerts, and sound alerts when new QQE signals appear.
Important Notes
- QQE signals are stronger when they align with the overall market trend.
- Using a 200 EMA or similar trend filter can improve signal selection.
- Divergence signals can provide early warnings but require confirmation.
- Momentum indicators perform differently across market conditions, so testing is recommended.
- Always apply appropriate risk management with every trading setup.









