
The Bheurekso Pattern indicator for MT5 is an advanced price action tool that automatically recognizes Japanese candlestick formations and displays them directly on the chart.
It identifies a wide range of single, double, and multiple candlestick patterns, helping you analyze market sentiment without manually inspecting every candle.
In addition to pattern recognition, the indicator plots important support and resistance levels and highlights possible reversal areas.
This combination allows you to evaluate both candlestick behavior and market structure from a single chart, making it an excellent addition to discretionary trading strategies based on technical analysis.
Why traders use the Bheurekso Pattern Indicator
Japanese candlestick patterns have been used for decades to evaluate buying and selling pressure.
Formations such as Bullish Engulfing, Bearish Engulfing, Harami, and other reversal patterns often provide valuable clues about changes in market sentiment.
Detecting every pattern manually can become time-consuming, especially when monitoring several charts simultaneously.
The Bheurekso Pattern Indicator continuously scans price action and labels recognized formations as they appear.
Combined with automatically generated support and resistance levels, it provides additional context for evaluating whether a pattern develops at a technically significant price area.
This allows you to focus more on trade selection and less on manual chart analysis.
Download This MT5 Indicator for Free
Indicator Chart Setup
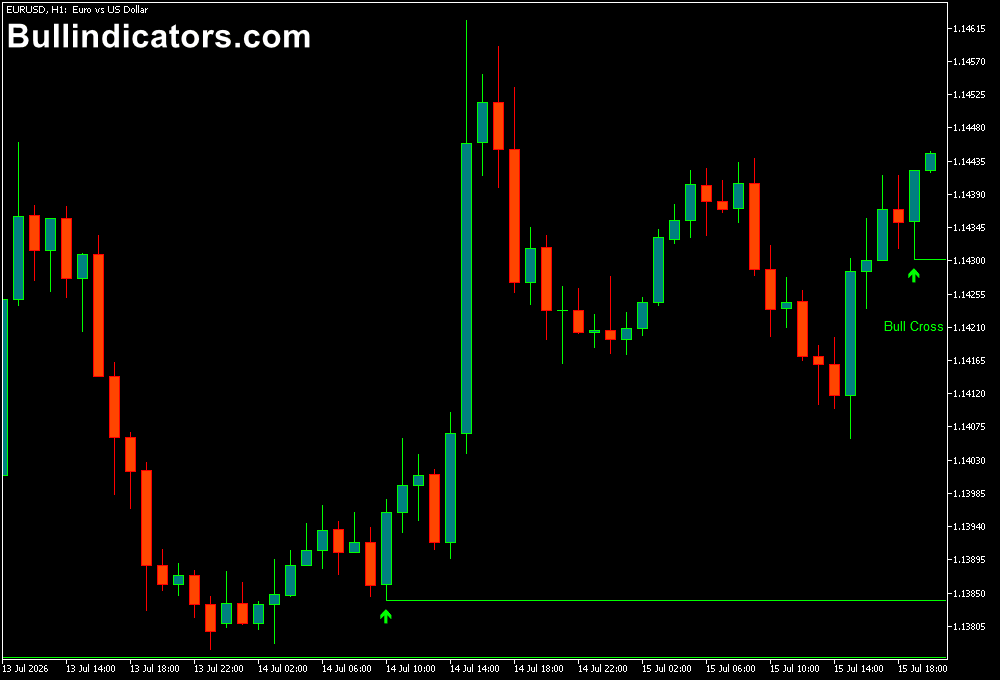
After applying the indicator to an MT5 chart, candlestick patterns are displayed with their corresponding names whenever valid formations appear.
In the EUR/USD H1 chart below, the indicator identifies a Bull Cross pattern.
Horizontal support and resistance levels are also drawn automatically, while potential entry areas become easier to identify when multiple technical factors align.
The chart remains organized, allowing you to quickly interpret market structure across different timeframes.
Core Features
- Automatic candlestick pattern recognition
- Detects bullish and bearish reversal formations
- Plots support and resistance levels
- Highlights potential entry opportunities
- Works on every MT5 timeframe
- Customizable visual settings
Best for
- Price action analysis
- Candlestick trading
- Support and resistance strategies
- Reversal trading
- Technical chart analysis
Best Markets
- Major Forex currency pairs
- Minor and cross currency pairs
- Gold (XAU/USD)
- Silver (XAG/USD)
- Global stock indices
- Cryptocurrency CFDs
Trading Styles
- Price action trading
- Swing trading around key technical levels
- Intraday chart pattern trading
- Support and resistance strategies
- Trend reversal analysis
- Higher timeframe confirmation trading
How traders use it
One common approach is to monitor higher timeframes for major support or resistance levels before switching to a lower timeframe to look for candlestick confirmation.
For example, a Bullish Engulfing pattern forming inside a strong support zone may provide a higher-quality buying opportunity than the same pattern appearing in the middle of a trading range.
The indicator can also be used to filter potential trades.
If several bullish reversal patterns develop while price continues making lower lows, waiting for additional confirmation may be the safer choice.
Likewise, bearish formations appearing near established resistance often provide stronger selling opportunities when they align with the prevailing market structure.
Get Instant Free Access
Indicator Settings
- Calc Bars: Defines how much historical price data the indicator scans for candlestick patterns. Higher values analyze more historical candles, while lower values focus on recent price action.
- Draw Lines: Enables or disables the automatic support and resistance lines displayed on the chart.
- Delete Irrelevant Patterns: Removes lower-quality or outdated candlestick patterns to keep the chart easier to read.
- Colors: Customize the appearance of candlestick labels, support and resistance levels, and other graphical elements.
Important Notes
- The strongest candlestick signals usually occur near established support and resistance.
- Higher timeframe patterns often carry greater significance than those on very small timeframes.
- Pattern recognition should be combined with sound risk management.
- Understanding basic Japanese candlestick theory helps interpret each signal more effectively.
- The indicator complements other technical tools such as trend indicators and momentum oscillators.









