
The Candlestick Pattern indicator for MT5 is an automated price action analysis tool that recognizes important Japanese candlestick formations and displays them directly on the chart.
It scans historical and live candles to identify potential reversal and continuation patterns, helping you analyze market behavior faster.
Candlestick analysis is one of the oldest methods used in technical trading because each candle represents the battle between buyers and sellers.
Patterns such as engulfing candles, pin bars, doji formations, and other price structures can provide valuable information about possible market direction changes.
This indicator removes the need to manually search for every formation by automatically labeling detected patterns.
It can be adjusted to focus on bullish, bearish, or uncertain formations, making it suitable for different trading approaches.
Why traders use the Candlestick Pattern Indicator
Recognizing candlestick formations correctly requires experience and constant chart monitoring.
The Candlestick Pattern Indicator simplifies this process by identifying potential setups and displaying the pattern name directly on the MT5 chart.
The main advantage is efficiency.
Instead of checking every candle manually, you can quickly see where important price action formations appear.
This makes the indicator useful for traders who use reversal strategies, breakout setups, or trend continuation methods.
Experienced market participants often combine candlestick signals with additional confirmation tools.
A pattern appearing at a major support level, resistance zone, or during an established trend can provide a stronger trading opportunity than an isolated candle formation.
Download This MT5 Indicator for Free
Indicator Chart Setup
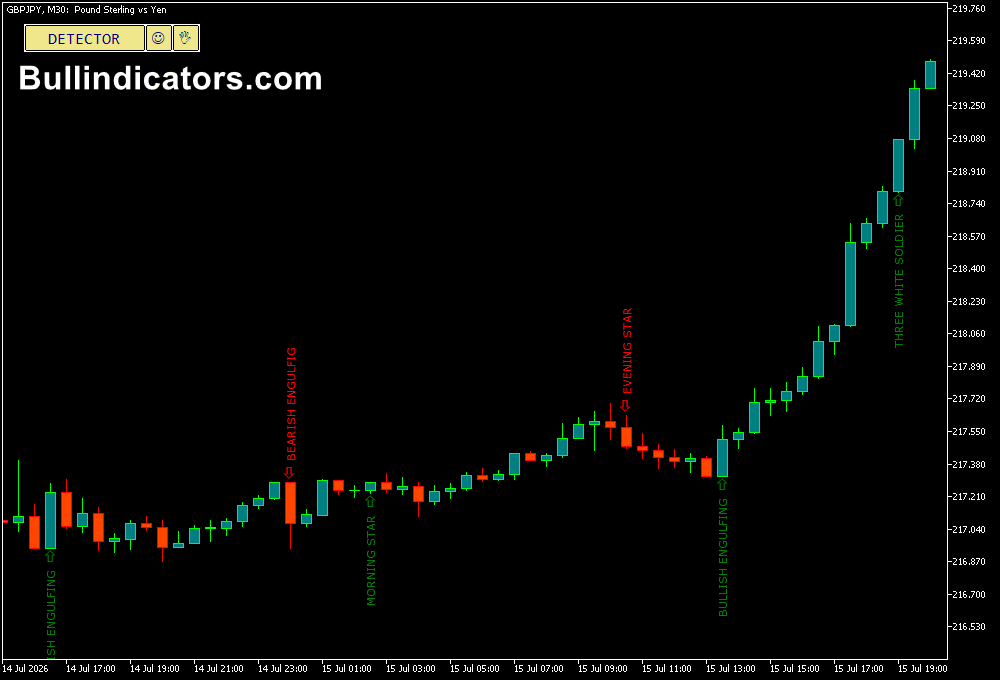
Once attached to an MT5 chart, the indicator scans available candles and displays detected formations with text labels.
Bullish patterns are shown using green color, bearish formations use red color, and uncertain patterns have their own visual identification.
The chart remains easy to read because the indicator focuses only on recognized candlestick structures.
Alerts can also be enabled, allowing you to receive notifications when new patterns appear without continuously watching the market.
Core Features
- Automatic candlestick pattern recognition
- Identifies bullish and bearish formations
- Optional uncertain pattern detection
- Displays candlestick pattern names on the chart
- Customizable visual appearance
- Multiple alert notification options
Best for
- Price action analysis
- Reversal pattern detection
- Trade entry confirmation
- Support and resistance strategies
- Learning Japanese candlestick formations
Best Markets
- EUR/USD and GBP/USD
- USD/JPY and USD/CHF
- Gold (XAU/USD)
- Major stock indices such as NAS100 and US30
- Commodity markets
- Liquid cryptocurrency pairs
Trading Styles
- Price action trading
- Trend continuation setups
- Reversal trading
- Breakout confirmation
- Swing trading
- Intraday technical analysis
How traders use it
The indicator can be used by waiting for a candlestick pattern to appear and then evaluating the surrounding market conditions.
For example, a bullish engulfing pattern forming near a strong support area may indicate increasing buying pressure.
A bearish rejection candle near resistance may suggest that sellers are becoming active.
A popular method is combining candlestick signals with a trend indicator.
For example, when using a moving average trend filter, traders can focus only on patterns that follow the dominant direction.
If price is above the 50 EMA and the Candlestick Pattern Indicator detects a bullish engulfing pattern after a pullback, the setup aligns with the overall bullish trend.
A bearish pattern appearing below the 50 EMA can be used as confirmation for possible short positions.
This approach helps filter weaker signals because the candlestick formation is supported by the broader market direction.
Additional confirmation can also come from momentum indicators, support and resistance levels, or breakout zones.
Get Instant Free Access
Indicator Settings
- Candles to Scan: Defines the number of historical candles analyzed by the indicator. Increasing this value allows more past formations to be displayed.
- Detect Bullish Patterns: Enables recognition of bullish candlestick formations.
- Detect Bearish Patterns: Enables recognition of bearish candlestick formations.
- Detect Uncertain Patterns: Activates detection of formations that do not have a clear bullish or bearish direction.
- Pattern Selection: Allows individual candlestick formations to be enabled or disabled according to your trading preference.
- Font Size: Adjusts the size of the candlestick pattern labels displayed on the chart.
- Font Color Bullish Patterns: Changes the appearance of bullish pattern names.
- Font Color Bearish Patterns: Changes the appearance of bearish pattern names.
- Font Color Uncertain Patterns: Changes the appearance of neutral or uncertain pattern labels.
- Alerts: Enables push notifications, email alerts, sound alerts, and on-screen notifications when new patterns are detected.
Important Notes
- Candlestick patterns become more reliable when they appear near important market levels.
- Not every detected formation creates a valid trading opportunity.
- Trend direction and market context should always be considered before entering a trade.
- Higher timeframe candlestick patterns generally carry more significance.
- Risk management remains essential when using any technical signal indicator.









