
The Banks Levels indicator for MT5 is a technical analysis tool that identifies important institutional price zones where major market participants may place significant orders.
Large financial institutions and liquidity providers often monitor specific price areas based on psychological levels, previous reactions, and historical market behavior.
This indicator automatically plots banking levels on the MT5 chart, helping you locate potential support and resistance zones without manually searching through historical price data.
These levels can highlight areas where price may reverse, consolidate, or accelerate during a breakout.
Designed mainly for short-term market analysis, the indicator is useful for intraday setups, scalping strategies, and price action trading.
It provides a clear view of important areas where buyers and sellers may compete for control.
Why traders use the Banks Levels Indicator
Key price levels often influence market behavior because many orders are concentrated around psychological numbers and previous reaction points.
The Banks Levels Indicator helps identify these areas automatically, allowing traders to focus on price behavior when the market approaches an important zone.
When price reaches a banking level, the reaction can reveal valuable information.
A strong rejection may indicate that buyers or sellers are defending the area, while a powerful breakout can suggest that momentum is increasing.
This makes the indicator suitable for both reversal setups and breakout strategies.
The indicator is also helpful for traders who follow institutional trading concepts because it provides a visual reference for areas where liquidity may be present.
Download This MT5 Indicator for Free
Indicator Chart Setup
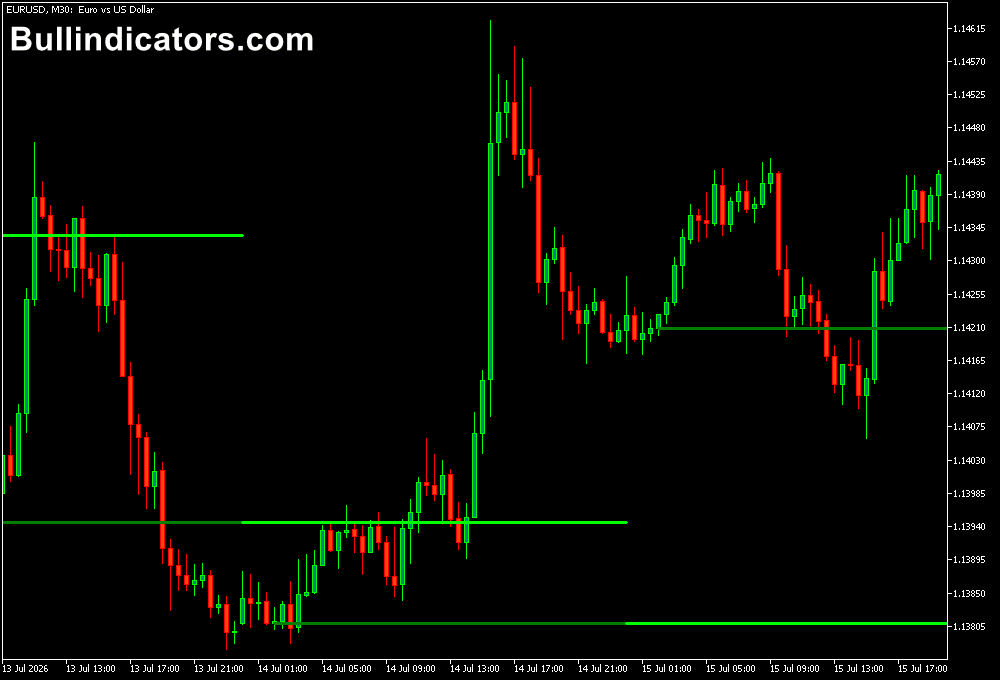
After installing the Banks Levels Indicator on an MT5 chart, horizontal banking levels are displayed automatically.
These levels represent important price zones calculated from previous market activity and psychological areas.
The current day levels are highlighted separately from historical levels, allowing you to quickly identify the most relevant intraday zones.
When price approaches one of these areas, you can monitor the reaction and look for confirmation signals before entering a position.
The indicator works best on lower timeframes, where short-term price movements around important levels can create trading opportunities.
Core Features
- Automatically detects important banking price levels
- Displays potential support and resistance zones
- Highlights current and historical market levels
- Useful for reversal and breakout analysis
- Designed for intraday trading strategies
- Simple chart presentation with customizable colors
Best for
- Finding key intraday price zones
- Support and resistance analysis
- Short-term market reactions
- Breakout and retest setups
- Price action confirmation
Best Markets
- EUR/USD, GBP/USD, and USD/JPY
- AUD/USD and NZD/USD
- GBP/JPY, EURJPY, and other volatile pairs
- Gold (XAU/USD)
- US indices such as NAS100 and US30
- Major Forex pairs with high liquidity
Trading Styles
- Scalping around key price levels
- Intraday reversal trading
- Breakout and retest strategies
- London session trading
- New York session momentum setups
- Short-term price action analysis
How traders use it
The most common approach is to wait for price to reach a banking level and then analyze the market reaction.
If price approaches support and forms a bullish rejection candle, such as a hammer or bullish engulfing pattern, this may indicate that buyers are defending the zone.
For example, if EUR/USD drops toward a banking support level during an active trading session and creates a strong bullish candle, a potential long setup may develop.
A stop loss can be placed below the support area, while profit targets can be based on the next resistance zone.
The indicator can also be used for breakout trading.
When price closes strongly beyond a banking level, it may indicate that market momentum has shifted.
Waiting for a retest of the broken level can help avoid entering during false breakouts.
The Banks Levels Indicator works well with trend confirmation tools such as the MA Crossover Alert Indicator for MT5.
For example, when price reaches a banking support level and the MA Crossover Alert generates a bullish crossover, the two signals align to confirm increasing buying pressure.
A similar approach can be used for short setups when price reacts from resistance and a bearish crossover appears.
Get Instant Free Access
Indicator Settings
- Start Hour: Determines the starting time used by the indicator when calculating and displaying banking levels.
- Days Ago: Controls how many previous days of banking levels remain visible on the chart. A higher value allows you to analyze more historical zones.
- Color Current Day: Changes the appearance of the current day’s banking levels for easier identification.
Important Notes
- The indicator is mainly designed for intraday trading and short-term analysis.
- Banking levels should be confirmed with price action or additional technical tools.
- Strong reactions near levels can provide reversal opportunities, while clean breaks may signal continuation.
- The best results often occur during active market sessions with higher liquidity.
- The indicator is most suitable for timeframes up to H1.









