
The Fibo Retracement indicator for MT5 is an automated Fibonacci analysis tool that identifies potential retracement areas during active market trends.
Strong price movements often create temporary pullbacks, making it difficult to determine whether the market is correcting or preparing for a trend reversal.
This indicator automatically draws Fibonacci retracement levels on the MT5 chart, helping you locate possible reaction zones where price may resume the dominant trend.
It focuses on active price movements and filters periods of low volatility, providing a cleaner view of important Fibonacci areas.
Fibonacci retracement levels are widely used in technical analysis because they help measure the depth of a correction.
When combined with trend direction, price action, and additional confirmation tools, these levels can become valuable areas for planning trade entries and managing risk.
Why traders use the Fibo Retracement Indicator
Identifying the end of a pullback is one of the biggest challenges in trend trading.
A retracement may represent a temporary correction before continuation, or it may develop into a complete trend reversal.
Fibonacci levels provide reference points where buyers or sellers may step back into the market.
The indicator saves time by automatically calculating and displaying important Fibonacci zones instead of requiring manual drawing after every market move.
Levels such as 38.2%, 50%, and 61.8% are frequently monitored because price often reacts around these areas.
Many technical traders use Fibonacci levels together with trendlines, moving averages, support and resistance zones, or momentum indicators to improve the quality of their setups.
Download This MT5 Indicator for Free
Indicator Chart Setup
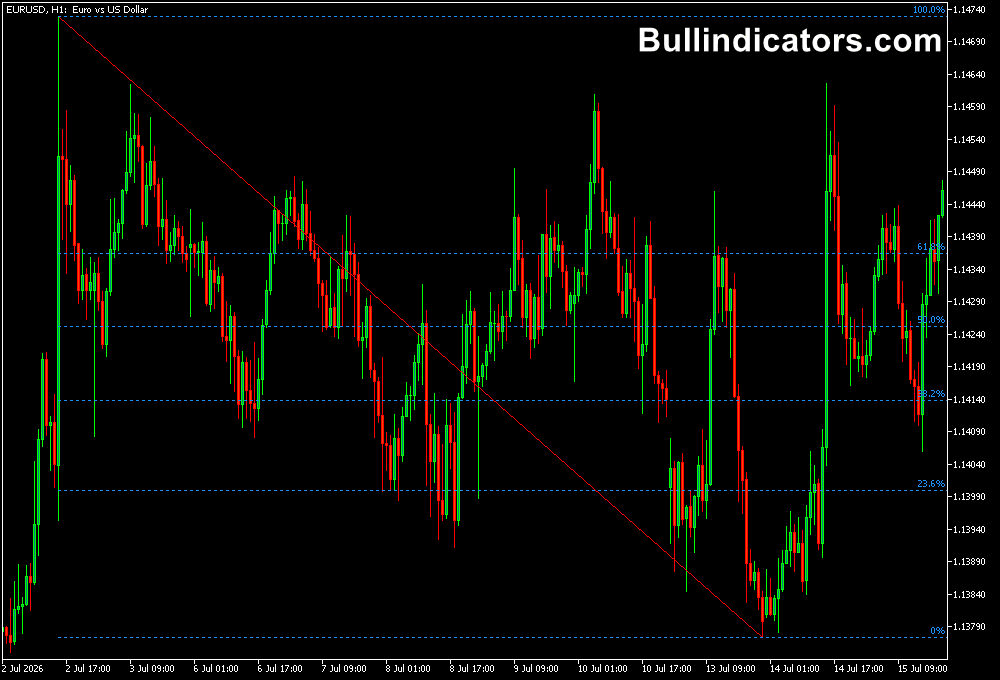
After applying the indicator to an MT5 chart, Fibonacci retracement levels are automatically displayed between important market swing points.
The indicator calculates the retracement zones and places the Fibonacci grid across the current price movement.
The main levels displayed include 0%, 23.6%, 38.2%, 50%, 61.8%, and 100%.
These areas act as potential zones where price may pause, reverse, or continue following the original trend.
The 61.8% level, also known as the golden ratio, is one of the most closely watched areas because many market participants monitor this zone for possible continuation entries.
Core Features
- Automatic Fibonacci retracement drawing
- Identifies potential pullback entry zones
- Displays important Fibonacci percentages
- Works with different trading timeframes
- Useful for trend continuation strategies
- Customizable visual settings and alerts
Best for
- Trend pullback analysis
- Finding potential reversal zones
- Entry point identification
- Support and resistance confirmation
- Technical market analysis
Best Markets
- EUR/USD, GBP/USD, and USD/JPY
- GBP/JPY and other trending currency pairs
- Gold (XAU/USD)
- NAS100 and major stock indices
- Oil and commodity markets
- Large cryptocurrency pairs
Trading Styles
- Trend continuation trading
- Swing trading
- Intraday pullback strategies
- Position trading
- Price action confirmation setups
- Multi-timeframe analysis
How traders use it
The Fibo Retracement Indicator is commonly used by waiting for a strong trend move followed by a correction toward a Fibonacci level.
When price reaches an important retracement area, traders look for confirmation signals before entering.
Example 1: Long Trade Setup
Assume EUR/USD is moving in a strong bullish trend on the H1 chart.
After reaching a new high, price begins a temporary decline and retraces toward the Fibonacci 50% level.
The indicator shows that the correction has reached a potential support area.
A bullish engulfing candle forms near the 50% Fibonacci zone, confirming that buyers are returning.
A long position can be considered after the confirmation candle closes, with the stop loss placed below the recent swing low.
The next resistance area or previous high can be used as a potential profit target.
Example 2: Short Trade Setup
Consider GBP/USD during a bearish trend. After a strong downward movement, price retraces upward toward the 61.8% Fibonacci level.
This area aligns with previous resistance, creating a potential selling zone.
A bearish rejection candle appears near the Fibonacci level, suggesting that sellers are defending the area.
A short position can be considered after confirmation, with the stop loss placed above the retracement high.
The previous low or a nearby support zone can be used as a target area.
Fibonacci levels become more reliable when they align with other technical factors.
For example, a retracement level matching a trendline, moving average, or previous support and resistance zone can create a stronger trading area.
Get Instant Free Access
Indicator Settings
- Colors: Customize the appearance of Fibonacci lines and level markings on the chart.
- Width: Adjusts the thickness of Fibonacci lines to improve chart visibility.
- Alerts: Enables notifications when price reaches important Fibonacci retracement levels.
Important Notes
- Fibonacci levels work best when combined with market structure and trend analysis.
- Not every retracement level creates a valid entry opportunity.
- Strong trends often produce shallower pullbacks, while weaker trends may retrace deeper.
- Confirmation from price action can improve entry timing.
- Always use proper risk management when trading Fibonacci-based setups.









